
Showing posts with label research. Show all posts
Showing posts with label research. Show all posts
Tuesday, July 15, 2014

Thursday, July 10, 2014
Pew: The State of Statehouse Reporting
 Just out is a new research report from Pew Research Center that looks into local state legislative reporting and staffing. It follows the general trend of newsroom staffing, with large declines in full-time newspaper newsroom staffing. Major findings include:
- Most news organizations don't have anyone assigned to the statehouse beat. Only 30% of daily papers and 14% of local TV news have anyone regularly covering the statehouse (either full- or part-time)
- 16% of reporters covering the statehouse work for nonprofits or digital-only sites. Interestingly, that's about the same percentage for full-time reporters, suggesting that nontraditional outlets are just as likely as traditional news outlets to assign the statehouse as a full-time beat
- Some 14% of statehouse reporters are actually students. (While not specifically addressed, it's likely that most of these are interns).

“I do think there’s been a loss in general across the country, and that’s very concerning to me,” said Patrick Marley, who covers the Wisconsin statehouse for the Milwaukee Journal Sentinel. “We have scads of reporters in Washington covering every bit of news that Congress makes. State legislators have more effect on people’s daily lives. We need to have eyes on them, lots of eyes.”Another concern is that many news organization are combining statehouse staffing and coordinating their coverage, which shrinks (if not eliminates) diversity and investigative reporting. The study also notes that most states are producing their own news feeds of statehouse activities, providing a cheap source for raw coverage and the potential for state actors to frame coverage to their advantage.
Sources: America's Shifting Statehouse Press: Can New Players Compensate for Lost Legacy Reporters, Pew Research Center
Full Research Report, Pew Research Center
Legislative Broadcasts and Webcasts, National Conference of State Legislatures
Wednesday, June 11, 2014
MSNBC remains as least trusted
Tacked onto a recent poll about immigration were some simple questions on which TV news sources were the most, and least trusted.

 That people's trust in news outlets is generally low is nothing new. Pew and Gallup both regularly ask about the public's trust in news media in their polling, and find trust declining, and also becoming more partisan - suggesting a perceived bias (check earlier posts here and here).
Source: Brookings Survey: The Most Trusted Name in Television News Is . . . Fox News, National Review Online
Overall, Fox News was viewed as most trustworthy by a quarter of the June 2014 sample, just beating off the combined total for the 3 broadcast networks (23%). CNN came in at 17%, PBS at 12 %. MSNBC fell below the satirical "faux-news" Daily Show, at just 5%. There were significant differences in trust among those with different political ideologies and party identifications, particularly when it came to Fox News. But MSNBC still couldn't garner support from more than 10% of Democrats or liberals.
That people's trust in news outlets is generally low is nothing new. Pew and Gallup both regularly ask about the public's trust in news media in their polling, and find trust declining, and also becoming more partisan - suggesting a perceived bias (check earlier posts here and here).
And the American left must be shocked and appalled that "rabid, extremist, right-wing Fox News" (their terms) remains the most trusted news outlet among news consumers - and remains the most-watched of the cable news outlets by huge margins. And that reliably leftist MSNBC remains among the least trusted sources for "accurate information about politics and current events," although it has managed to capture second place in viewership from CNN.
Source: Brookings Survey: The Most Trusted Name in Television News Is . . . Fox News, National Review Online
Thursday, May 1, 2014
Globally, Press Freedom down in 2014 reports

“We see declines in media freedom on a global level, driven by governments’ efforts to control the message and punish the messenger,” said Karin Karlekar, project director of the report. “In every region of the world last year, we found both governments and private actors attacking reporters, blocking their physical access to newsworthy events, censoring content, and ordering politically motivated firings of journalists.”Overall, the report concurs with the Reporters Without Borders recently released World Press Freedom Index 2014 report. Levels of press freedom are declining in many cases, due to spreading conflict and "a tendency to interpret national security needs in an overly broad and abusive manner to the detriment of the right to inform and be informed."

It's been a tough few years for the press.
Sources - "Freedom House report cites lowest global press freedom in a decade," Poynter.org
Freedom of the Press 2014 report, Freedom House
World Press Freedom Index 2014 report, Reporters Without Borders
edited to add Freedom House 2014 map, and reposition other graphic (2 May, 11:30 a.m. EDT)
Monday, March 31, 2014
Pew: Social News
Pew's State of News Media 2014 report includes a look at the growing role of social media in news consumption. Here's some highlights:


- News has a place in social media, but usage varies by site. Half of Facebook and Twitter users get news through their sites, as do 62% of Reddit users. With Facebook's high penetration, that means about 3 in 10 Americans get some news from Facebook. There's also some variation in use by site: Twitter is used to get breaking news, while Facebook is used more to share news with friends and followers. 78% of those getting news via Facebook see news items while using Facebook for other purposes.
- Audiences for news on social media differ by platform
- Social media carries, and is used by news consumers, for a wide range of topics. Almost half of Facebook news users report that they get news on 6 or more topics. Top news categories on Facebook include Entertainment News, Local community news, and sports. Local news topics account for at least 3 of the top 10 topics (I suspect a lot of the interest in, and use of, sports news is about local teams and events).

- Social news users not only get news via their social media, they're increasingly engaged with it: sharing or reposting news, discussing news, and posting their own photos, videos, and information about news events.
- News consumers who go directly to news sites for their news tend to be much heavier news users than those who get to news sites through Facebook or search engines. Those going directly to news sites go more often, consume more content, and spend more time than those arriving at news sites via referrals from social media and search engines.

- On Twitter, groups of people often come together in response to news events they care about. These groups tend to be those with strong opinions, which aren't likely to reflect broad public opinion. In addition, the rapid pace, short content limits, and lack of gatekeeping on Twitter means that initial opinions may be moderated as news consumers get more information
Sources - 8 Key Takeaways about Social Media and News, PewResearch Journalism Project report
State of the News Media 2014, full PewResearch Journalism Project study
Wednesday, March 26, 2014
State of the News Media 2014 - Pew's annual report
The Pew Research Journalism Project has just released its annual State of the (US) News Media report for 2014. It's a big report with a lot of information, conclusions, and recommendations.
 The report suggests that 2013 (and the early part of 2014) has seen the continuing transformation of the U.S. marketplace for news - on both the supply and demand side. It's seen an explosion in digital news outlets, "bringing technological knowhow and new money and luring top talent." It's seen the development of new and alternative revenue sources, the expansion of news into social media channels. As a result, the way people seek and consume news is changing; the report suggests that "the level of new activity this past year is creating a perception that
something important, perhaps even game-changing, is going on."
The report suggests that 2013 (and the early part of 2014) has seen the continuing transformation of the U.S. marketplace for news - on both the supply and demand side. It's seen an explosion in digital news outlets, "bringing technological knowhow and new money and luring top talent." It's seen the development of new and alternative revenue sources, the expansion of news into social media channels. As a result, the way people seek and consume news is changing; the report suggests that "the level of new activity this past year is creating a perception that
something important, perhaps even game-changing, is going on."
The reports overview identifies six major trends:
Sources - State of the News Media 2014: Overview, report by PewResearch Journalism Project.
State of the News Media 2014 Complete Report
The reports overview identifies six major trends:
- The expansion of digital news outlets is creating job opportunities, particularly in the form of international reporting.
- The new money and digital outlets "may be more about fostering new ways of reporting and reaching audience" than developing sustainable revenue streams.
- Developments in social and mobile are changing the dynamics of news production and consumption.
- The new digital forms are fostering "new ways of storytelling," but bring both promise and challenge.
- Local TV underwent massive change in ownership structures in 2013, with greater use of "shared content" in local newscasts.
- News outlets are just beginning to recognize the shifting demographics of U.S. audiences, primarily in the expansion of Spanish-language content and outlets.
Sources - State of the News Media 2014: Overview, report by PewResearch Journalism Project.
State of the News Media 2014 Complete Report
Monday, March 24, 2014
Web@25 - Graphics version
From Web Turns 25: 10 Graphics to See, Information Week -

 Visualization of Website traffic
 Social networking through Facebook
 Web Health around the world
(Access, openness, content, empowerment)

(Access, openness, content, empowerment)


Tuesday, March 11, 2014
Pew's Web@25 Studies
 The Pew Research Center has released a series of reports on the history, status, and future of the Internet, in conjunction with the 25th Anniversary of the World Wide Web.
The Web at 25 in the U.S. looked at a range of surveys looking at how the Internet is used by people, and their views of the Internet and the content and services it offers. Over the 25 years of the Web, internet usage among U.S. adults has grown from 14% to 87%. 90% of those surveyed earlier this year indicated that the Internet has been beneficial for them, while 76% indicated that they thought the Internet had been good for society. In fact, the Internet is the technology that people are least willing to give up. In fact, a range of digital and mobile technologies have become an integral, and crucial, part of people's lives.
And while press coverage and political discussions often focus on the more negative aspects of the Web, most users (76%) report that they've been treated well (kind or generous) in their online interactions, two-thirds (67%) felt that online communication has strengthened their relationships with friends and family, more than half (56%) indicate they've witnessed online groups coming together to help people or to solve a community problem. In contrast, only 25% report ever been treated badly or have ever abandoned a site or service because it's gotten ugly (users attacked or discussions becoming virulent).

Digital Life in 2025 summarizes the predictions of a group of key experts. Most agreed on the key technological trends - that the Internet will become even more ubiquitous, integrated, and immersive; that the Web will increasingly integrate tags, sensors, apps, and intelligent agents to facilitate people's ability to use online content and services. They also widely agreed that the digital network economy will disrupt 20th century business models. This can be beneficial, creating the potential for fostering awareness and understanding, building relationships, and promoting collaboration and social group action. On the other hand, the same potential can provide opportunities for abuse. But the biggest threat is the possibility that nations (or other organizations) could co-opt the network, restricting and limiting the Web's potential through imposed regulations and structured access - turning the Internet into an instrument of political and social control rather than an open marketplace.
The choices we make today - our willingness to trade freedom for security, diversity for the safety of conformity, and privacy for convenience - will go a long way to determining what kind of internet we'll have in the future, and whether it remains a social good, or a mechanism for control.
Sources - What the Internet of 2025 Might Look Like, WSJ.com
The Web at 25 in the U.S., PewResearch Internet Project report
Digital Life in 2025, Pew Research Internet Project report
Tuesday, February 11, 2014
IAB: Metrics for Cross-Platform
Measuring passive audiences for one media platform is difficult enough - what about developing a metric that tries to measure interactive engagement and involvement across multiple platforms. A number of major research firms are working on the problem, lead by Nielsen (looking to expand broadcast ratings to online) and comScore (looking to extend online metrics to broadcast and print).
 Overseeing these efforts is the Interactive Advertising Bureau (IAB), an advertising and marketing industry group, which is setting guidelines and standards that the industry wants any cross-platform and interactive audience metrics to incorporate before they will be adopted by the industry. The IAB has recently released a report setting out some basic definitions and outlining six broad goals and 30 core metrics that should be incorporated into proposals for industry-acceptable interactive advertising measures.
The goals recognize that it may be difficult, if not impossible, to build one single effective measure - still, core metrics need to be comparable to those used for other media, and have achievable benchmarks of objective performance. The report also stresses that social media encompasses more than a single form of engagement.
Determining what you want to know is (or at least should be) one of the first steps in research, and particularly in the development of reasonable and valid quantitative measures. Too many of the traditional metrics for traditional media were based on what could be easily measured rather than trying to measure the things that those using the metrics really wanted to know. It's good that the industry is thinking about what it really wants to know about interactive advertising exposure and effectiveness, and isn't rushing to adopt something this time (despite Nielsen's several attempts to jump the gun and get the industry to support it's product).
Sources - IAB Redefines Ad Engagement, Clarifies Core Metrics Cross-Platform, Media Daily News
Defining and Measuring Digital Ad Engagement in a Cross-Platform World, IAB report
The goals recognize that it may be difficult, if not impossible, to build one single effective measure - still, core metrics need to be comparable to those used for other media, and have achievable benchmarks of objective performance. The report also stresses that social media encompasses more than a single form of engagement.
Determining what you want to know is (or at least should be) one of the first steps in research, and particularly in the development of reasonable and valid quantitative measures. Too many of the traditional metrics for traditional media were based on what could be easily measured rather than trying to measure the things that those using the metrics really wanted to know. It's good that the industry is thinking about what it really wants to know about interactive advertising exposure and effectiveness, and isn't rushing to adopt something this time (despite Nielsen's several attempts to jump the gun and get the industry to support it's product).
Sources - IAB Redefines Ad Engagement, Clarifies Core Metrics Cross-Platform, Media Daily News
Defining and Measuring Digital Ad Engagement in a Cross-Platform World, IAB report
Thursday, February 6, 2014
The State of Video Streaming: Sports
NBC and the BBC hit it big by streaming every moment of every event at the 2012 London Olympics, and currently plan on doing the same this year for the Sochi Winter Olympics (as long as the Russian government doesn't block things). The breadth and success of those 2013 Olympic efforts prompted a lot of audience trying and sampling.
And then there's the runaway success of Netflix and its brethren.
All of this showed promise of a spurt in the use of video streaming for watching sports - which is being confirmed by the latest Adobe Digital Video Benchmark report.
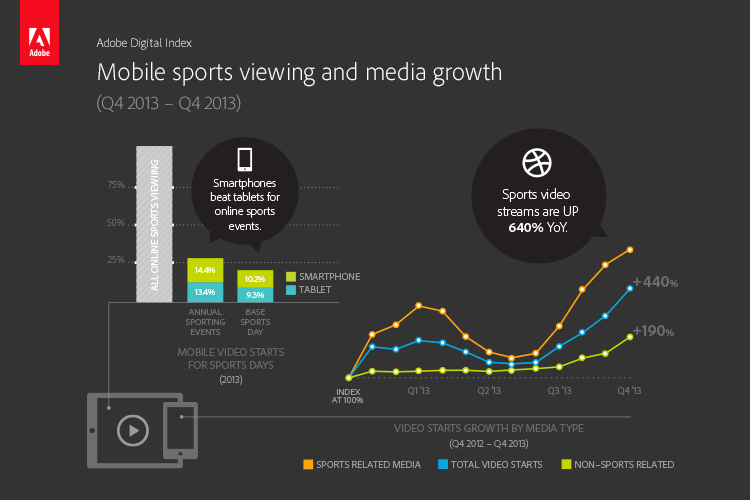 The 2013 4th quarter report shows that sports video streaming has gone up 640% increase over the previous year.
In addition:
Adobe Digital Index Benchmark Report, Q4 2013, Adobe
And then there's the runaway success of Netflix and its brethren.
All of this showed promise of a spurt in the use of video streaming for watching sports - which is being confirmed by the latest Adobe Digital Video Benchmark report.
The 2013 4th quarter report shows that sports video streaming has gone up 640% increase over the previous year. In addition:
- 37% of TV Everywhere content streams are for sporting events
- More than a quarter of video streaming for major annual and bi-annual events are accessed by mobile devices.
- Such special events see twice the mobile sports streams than the average
- Watching sports streams on mobile is up 73% over the last year
- Most mobile viewing for big events is on smartphones
Campbell Foster, director of product marketing for Adobe Primetime, the company’s TV publishing infrastructure platform for service providers, said the data back up what many other industry observers have noted about sports: It is engagement viewing that fans don’t want to miss, so they use whatever device they can to watch.Sources - Adobe research finds mobile sports viewing driving huge growth in digital video, Mobile Sports Report
Adobe Digital Index Benchmark Report, Q4 2013, Adobe
Tuesday, November 12, 2013
History of Market Research

Online research firm Vision Critical has produced an interesting moving graphic - "Evolution of Insight" - that tracks key events in the developing of marketing research since the 1890s.
It's worth a look.
Source - Evolution of Insight, Vision Critical moving graphic
Tuesday, October 15, 2013
NY Times: A third of Millenials don't do "TV"
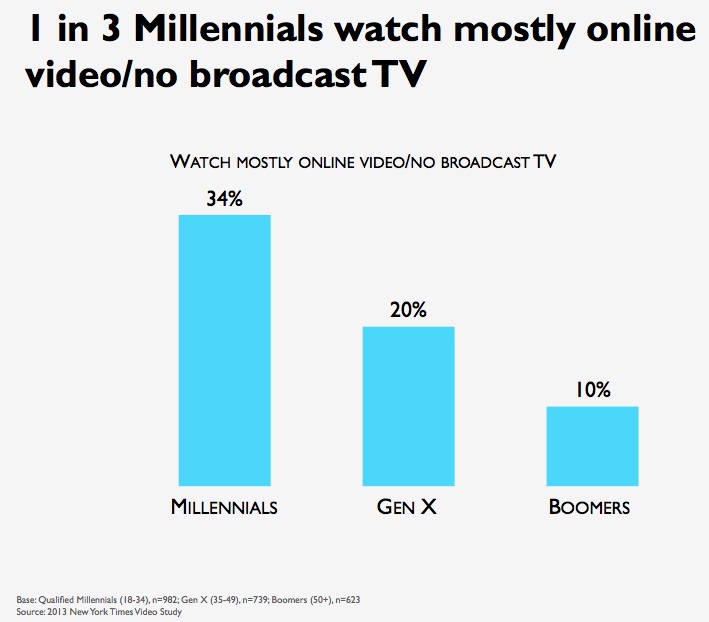
I should note that this was a nonrandom sample of a subset of US adults, and so the resulted are probably not representative, although the patterns of responses within the sample can be insightful.
The study had some other interesting news on the journalism front. More than a quarter of the sample (28%) listed news sites as among their favorite video sites, and more than a third (35%) indicated that they had increased the amount of time spent on news/current events. There was also a significant preference in the sample for "reading" news rather than watching news videos.
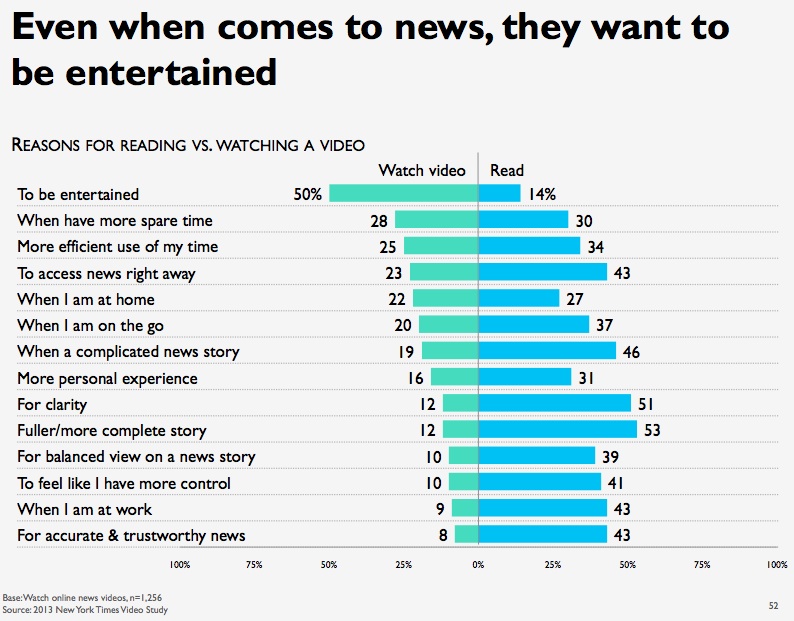 Among the various reasons offered for getting news videos or reading news stories, news videos outperformed reading in only one - "To be entertained." (50% to 14%)
In contrast, respondents preferred to read about news -
"To get news right away" (43% to 23%)
For a "complicated news story" (46% to 19%)
"For clarity" (51% to 12%)
To get "fuller/more complete story" (53% to 12%)
For a "balanced view" (39% to 10%)
For "accurate & trustworthy news" (43% to 8%)
Source - Third of millennials watch mostly online video or no broadcast TV, Poynter
Thursday, October 10, 2013
Latest Research on Online Video 3: Magid Connected Culture report
Three research reports on aspects of video/TV viewing and use have been released recently.
 A nationwide study from Frank N. Magid Associates characterizes the role of mobile devices as "the beating heart of content and commerce." Perhaps a bit of hyperbole, but the rapid adoption of smartphones and tablets, and the increased availability of compelling high-quality content is certainly impacting, and shifting, audience viewing behaviors. The audience for mobile TV and video is there - the report finds 74% of U.S. "mobile consumers" have a smartphone, and 52% use tablets. 71% of tablet viewers, and 45% of smartphone viewers, now watch long-form TV, movies, and sports content on their devices.
Perhaps the most striking indication of that shift is the finding that digital and mobile devices are becoming the dominant source of entertainment for the 18-34 age group: smartphones/tablets account for 35%, PCs/laptops at 34%, while traditional television trails at 21%.
The Heartbeat of Connected Culture - Magid Smartphone and Tablet Study 2013
Perhaps the most striking indication of that shift is the finding that digital and mobile devices are becoming the dominant source of entertainment for the 18-34 age group: smartphones/tablets account for 35%, PCs/laptops at 34%, while traditional television trails at 21%.
"Consumers have made the clear leap into mobile long-form," says Andrew Hare, Magid Research Director. "Beyond just TV and traditional video consumption, however, the visual culture has taken over with the growth of Instagram, Tumblr, Pinterest, Snapchat, and Vine showing consumers increasingly prefer to communicate through images and video."Sources - 'Mobile is the new TV', finds Magid study, Broadcast Engineering
The Heartbeat of Connected Culture - Magid Smartphone and Tablet Study 2013
Latest Research on Online Video 2: Avid/Ovum Consumer Trend study
Three research reports on aspects of video/TV viewing and use have been released recently.
The Avid/Ovum white paper - Consumer Trend Research: Quality, Connection, and Context in TV Viewing - takes a different research approach. The study surveys industry professionals about the trends and shifts they see in their fields, along with a cross-national web survey of consumers. Some of the reported results from the survey of industry professionals -
The consumer survey resulted in what they termed "5 key insights"

The survey also asked those who expressed a willingness to pay for TV and video content just how much they'd be willing to spend. They highest average was for "the latest Hollywood movie" ($3.62 avg) and watching a "favorite sports event on demand in HD" ($2.37). The averaged amounts for comedy and reality shows, old episodes of favorite series, episodes of current drama programs, and favorite news programs were all in the $1 - $1.50 range.
Source - Consumer Trend Research: Quality, Connection, and Context in TV Viewing, Avid/Ovum white paper
The Avid/Ovum white paper - Consumer Trend Research: Quality, Connection, and Context in TV Viewing - takes a different research approach. The study surveys industry professionals about the trends and shifts they see in their fields, along with a cross-national web survey of consumers. Some of the reported results from the survey of industry professionals -
- 71.5% of those interviewed felt that at least 19% of audience TV viewing will be delivered by web-based services by the end of 2017. More than a quarter felt that at least 30% of viewing will be web-based by that time.
- 91% felt that web-delivered video and TV will be a key area for revenue growth
- Quality is a primary concern for consumers that drives their use of online video. 65% identify the audio and visual experience as a key factor in their enjoyment and use of online video. About the same percentage (66%) indicated that they would watch ads if the content was "high quality."
- Quality also drives engagement and ad recall. 47% said they remember ads if they're funny, 32% indicate that they recall ads with good, engaging, storylines, and 31% recall ads with well-developed characters.
- Multi-platform delivery drives value and extends viewing lifecycle. While consumers report that they're most likely to hear about new shows through network promos, 14% report testing out new shows via mobile viewing. 30% say if they like what they see they'll shift to more normal appointment-based viewing.
- There is profit potential in media archives. More than a third of the sample (37%) said they were prepared to pay for access to old episodes of favourite shows. That's more than indicated they'd be willing to pay for access to news or current shows. However, a lot of older material is not currently accessible.
- Second screens create opportunity in mass media events. When watching the last Olympics, 63% of those consumers with PCs, smartphones, or tablets reported using them to find other scores, seek more match information, or watch other events or highlights.
The survey also asked those who expressed a willingness to pay for TV and video content just how much they'd be willing to spend. They highest average was for "the latest Hollywood movie" ($3.62 avg) and watching a "favorite sports event on demand in HD" ($2.37). The averaged amounts for comedy and reality shows, old episodes of favorite series, episodes of current drama programs, and favorite news programs were all in the $1 - $1.50 range.
Source - Consumer Trend Research: Quality, Connection, and Context in TV Viewing, Avid/Ovum white paper
Monday, October 7, 2013
Pew: Social Networking penetration, use in US


Younger adults are avid adopters and users, but social networking is also becoming widely used by older adult: 60% of internet users aged 50-64 use it, as do 43% of those 65 or older. Minorities (Hispanics 80%, Blacks 75%) are heavier adopters than whites &70%). Interestingly, there were no statistically significant differences in terms of gender, education, location, or income.


Source - 72% of Online Adults are Social Networking Site Users, Pew Internet & American Life Project research report.
Full research report as PDF file
Friday, October 4, 2013
Pew: Perilous Future for News
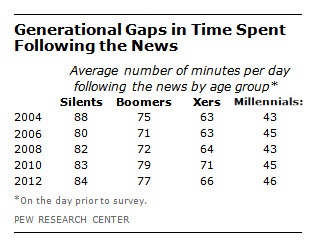
The generational decline is significant, and also fairly consistent over the last decade. (Silents are currently 67-86; Boomers 48-66, Gen Xers 33-47, Millenials 18-31). One reason that Pew points out is that younger generations don't enjoy following the news. For Silents and Boomers, 58% reported that they enjoyed following news "a lot". Less than half of Gen Xers (45%) did so, and less than a third of Millenials (29%).
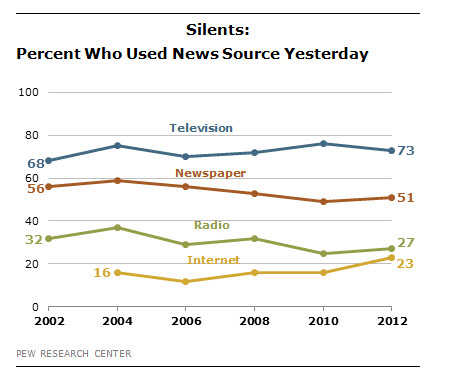
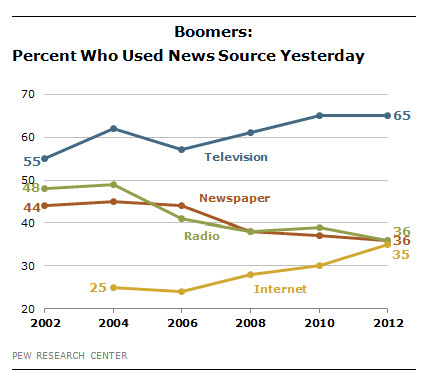
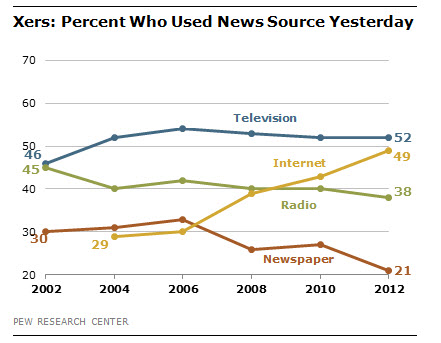
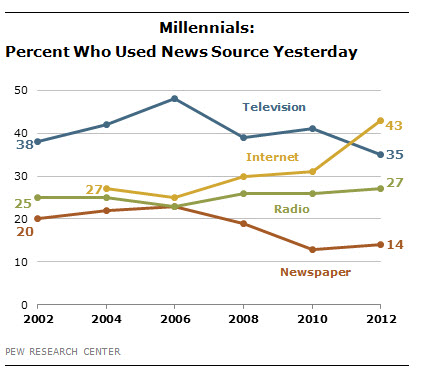
For Millennials (18-32), the Internet became the most widely used source for news in the last few years, with 43% reporting that they went online for news "yesterday." TV as a source has fallen from a peak reported use of 49% in 2006 to 36% in 2012, and Newspapers falling from a peak of 22% in 2006 to 14% in 2012. What's interesting for this group is that use of Radio for news has remained fairly consistent, with around a quarter of Millennials reporting using Radio for news "yesterday."
Looking at the generational use patterns can also reinforce the conclusion that there is a generational gap in news consumption. Looking at the highest reported use of a medium for news "yesterday" in 2012 -
- for Millennials, that's the Internet at 43%
- for Gen Xers, that's TV at 52%, but also a greater percentage reported using the Internet (49%)
- for Boomers, that's TV at 65%, with even the least used (Internet) at 35%
- for Silents, that's TV at 73%, and Newspaper (at 51%) more widely used than any Millennial use
For all the potential bad news for the traditional news media, social media looms as a potential booster of news consumption among the younger generation, albeit a modest one so far. Pew Research’s 2012 survey found a third of Millennials and 20 percent of Xers saying they regularly see news or news headlines on social-networking sites. However, only about 35 percent of those who get news from social network sites say they follow up and seek out full news stories.We are living in interesting, and uncertain, times for media and journalism. (So keep following this blog or the JEMS Flipboard magazine.)
Source - Pew surveys of audience habits suggest perilous future for news, Poynter
Monday, August 19, 2013
Network Website Most Usable

(Anecdotally, as a user of both Hulu and Netflix, I'll agree that navigating their sites can be frustrating, particularly on mobile devices and through set-top boxes. The visual interface is nice, and Netflix's recommendation system is a plus when you're looking for something to watch, but finding something specific can be a hassle. But their real strength is the vast range of content available - something that does make search a bit more problematic.)
On the down side for the networks, the research showed that the network websites didn't do very well when it came for finding out about new shows, show schedules, or when a new season of episodes is starting.
Surprise: Network TV sites out-web Web OTT giants, Broadcast Engineering
Tuesday, August 13, 2013
Pew releases 2013 State of News Media report and Infographic

High among the issues is what Pew terms a decline in news reporting resources. Continued newspaper newsroom cutbacks put industry employment below 40,000 full time employees (the lowest since 1978) and 30% below peak newspaper employment levels in 2000. And this spring and summer has seen many newspapers cut their photo departments, instead telling their reporters to use their cellphones to photograph events. This has impacted content, with Pew research showing that sports, weather, and traffic now account for 40% of newscast content, while the average length of video news stories continues to shrink. Cable news channel live coverage shrank some 30%, while interview segments increased 31%. As the report summarizes,
This adds up to a news industry that is more undermanned and unprepared to uncover stories, dig deep into emerging ones or to question information put into its hands. And findings from our new public opinion survey released in this report reveal that the public is taking notice. Nearly one-third of the respondents (31%) have deserted a news outlet because it no longer provides the news and information they had grown accustomed to.The report also notes that the last few years have also seen a significant rise in newsmakers and others seeking to put information in front of people using online and social media to take their message directly to the people, without the gatekeeping and contextualizing that news organizations normally provide. A study suggested that in 2012, that resulted in campaign reporters acting more as megaphones for the campaign than objective (and critical) reporters. One consequence, Pew found, was that in all the coverage of the character and records of the candidates, less that a quarter originated from traditional reporting activities, while more than half originated from claims by political partisans.
The good side of this trend is that groups and organizations with more specific interest and expertise, were using the Internet to provide coverage of topics that traditionally have not been a major component of traditional news products (for example, health, science, environment).
I'll try to get to take a look at the reports details in later posts. Meanwhile, you can grab the infographic at http://stateofthemedia.org/files/2013/03/2013-State-of-the-News-Media-Overview-Infographic.png

Source: The State of the News Media 2013, report from Pew Research Center's Project for Excellence in Journalism
Wednesday, August 7, 2013
FCC Releases 15th Video Competition Report

With this report, the FCC has distinguished three types of video channels
- MVPDs -Multichannel Video Programming Distributors (Cable, DBS, and Telco cable),
- Broadcast Television Stations (over-the-air free broadcasting), and
- OVDs - Online Video Distributors (any service delivering video over the Internet)
Between the last report's data collection (Dec, 2010) and this (June, 2012), there has been a slight growth in MVPD subscribers. However, cable has continued to lose market share to DBS and Telco cable.
The push for 'TV Everywhere" has grown in the last two years, with an estimated 5.1% of the MVPD audience using it as of Sept 2012.
MVPD systems continue to shift from analog services to digital. Among the top 8 cable MSOs, more than half of their customers receive all-digital service. DBS and Telco cable are already all-digital. Larger cable MSOs are also experimenting with switched digital video, where only the channels being watched are transmitted to the home.
Roughly three quarters of US homes can receive and display digital signals; 43.8% have DVR capability; and there is increasing availability of video-on-demand access of recent content.
Less than 10% of US homes rely on over-the-air broadcasting for video access. In contrast, viewing of video content from online sources (OVDs) is growing, with estimates that more than a fifth of US homes are "Internet-connected" - that is, capable of watching online video on a TV set. The continued growth of OVD viewing is increasing Internet traffic in peak hours, to the point where ISPs are increasingly considering imposing bandwidth caps.
Source - FCC Adopts 15th Video Competition Report, FCC report
Subscribe to:
Posts (Atom)