From The World of Social Media Monitoring And Analytics, Digital Information World
This blog is affiliated with a course at the School of Journalism & Electronic Media at the University of Tennessee, Knoxville. I'll try to use it to share relevant news and information with the class, and anyone else who's interested.
Showing posts with label metrics. Show all posts
Thursday, April 3, 2014
Monday, March 24, 2014
Metrics - Nielsen undercounting online video?
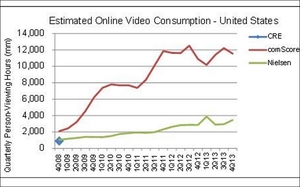
A report from Pivotal Research Group suggests a large and growing gap in measuring online video use. The study compared metrics from Nielsen with those coming from comScore, showing a sizable and growing gap in terms of online video usage between the two metrics. Currently, the estimates from comScore show roughly 3 times the amount of online video viewing as suggested by Nielsen's current proposed metric.
There are several reasons for the difference. One major difference is in how each defines "online video viewing": comScore includes both streams and downloads, and counts all video streams; while Nielsen only includes streams of TV programming. (Nielsen relies on embedded tags to measure TV viewing; Netflix, for example, strips all of those tags from the videos it streams, so Nielsen doesn't include any viewing from the dominant online video streaming service). Then again, Nielsen is funded by TV networks, stations, and broadcast advertising industry, so might be more conservative in measuring viewing that isn't ad-supported. comScore, on the other hand, is the primary metric used by online advertising industry, as it more directly counts viewing of online video ads. Neither metric currently includes viewing on the full range of mobile devices, however.
Based on numbers from the last quarter of 2013, comScore put online viewing at 8.6% of all TV viewing (15% among active online video users). Nielsen placed total online viewing at 2.6% (4.9% for active online video users).
Source - Report Reveals Gross Disparity In Online Video Ratings, Implies Overstatement, Online Video Daily
There are several reasons for the difference. One major difference is in how each defines "online video viewing": comScore includes both streams and downloads, and counts all video streams; while Nielsen only includes streams of TV programming. (Nielsen relies on embedded tags to measure TV viewing; Netflix, for example, strips all of those tags from the videos it streams, so Nielsen doesn't include any viewing from the dominant online video streaming service). Then again, Nielsen is funded by TV networks, stations, and broadcast advertising industry, so might be more conservative in measuring viewing that isn't ad-supported. comScore, on the other hand, is the primary metric used by online advertising industry, as it more directly counts viewing of online video ads. Neither metric currently includes viewing on the full range of mobile devices, however.
Based on numbers from the last quarter of 2013, comScore put online viewing at 8.6% of all TV viewing (15% among active online video users). Nielsen placed total online viewing at 2.6% (4.9% for active online video users).
Source - Report Reveals Gross Disparity In Online Video Ratings, Implies Overstatement, Online Video Daily
Tuesday, February 11, 2014
IAB: Metrics for Cross-Platform
Measuring passive audiences for one media platform is difficult enough - what about developing a metric that tries to measure interactive engagement and involvement across multiple platforms. A number of major research firms are working on the problem, lead by Nielsen (looking to expand broadcast ratings to online) and comScore (looking to extend online metrics to broadcast and print).
Overseeing these efforts is the Interactive Advertising Bureau (IAB), an advertising and marketing industry group, which is setting guidelines and standards that the industry wants any cross-platform and interactive audience metrics to incorporate before they will be adopted by the industry. The IAB has recently released a report setting out some basic definitions and outlining six broad goals and 30 core metrics that should be incorporated into proposals for industry-acceptable interactive advertising measures.
The goals recognize that it may be difficult, if not impossible, to build one single effective measure - still, core metrics need to be comparable to those used for other media, and have achievable benchmarks of objective performance. The report also stresses that social media encompasses more than a single form of engagement.
Determining what you want to know is (or at least should be) one of the first steps in research, and particularly in the development of reasonable and valid quantitative measures. Too many of the traditional metrics for traditional media were based on what could be easily measured rather than trying to measure the things that those using the metrics really wanted to know. It's good that the industry is thinking about what it really wants to know about interactive advertising exposure and effectiveness, and isn't rushing to adopt something this time (despite Nielsen's several attempts to jump the gun and get the industry to support it's product).
Sources - IAB Redefines Ad Engagement, Clarifies Core Metrics Cross-Platform, Media Daily News
Defining and Measuring Digital Ad Engagement in a Cross-Platform World, IAB report
Overseeing these efforts is the Interactive Advertising Bureau (IAB), an advertising and marketing industry group, which is setting guidelines and standards that the industry wants any cross-platform and interactive audience metrics to incorporate before they will be adopted by the industry. The IAB has recently released a report setting out some basic definitions and outlining six broad goals and 30 core metrics that should be incorporated into proposals for industry-acceptable interactive advertising measures.
The goals recognize that it may be difficult, if not impossible, to build one single effective measure - still, core metrics need to be comparable to those used for other media, and have achievable benchmarks of objective performance. The report also stresses that social media encompasses more than a single form of engagement.
Determining what you want to know is (or at least should be) one of the first steps in research, and particularly in the development of reasonable and valid quantitative measures. Too many of the traditional metrics for traditional media were based on what could be easily measured rather than trying to measure the things that those using the metrics really wanted to know. It's good that the industry is thinking about what it really wants to know about interactive advertising exposure and effectiveness, and isn't rushing to adopt something this time (despite Nielsen's several attempts to jump the gun and get the industry to support it's product).
Sources - IAB Redefines Ad Engagement, Clarifies Core Metrics Cross-Platform, Media Daily News
Defining and Measuring Digital Ad Engagement in a Cross-Platform World, IAB report
Monday, January 27, 2014
Nielsen offloads LinkMeter project
When Nielsen acquired Arbitron, one potential regulatory roadblock was Arbitron's LinkMeter and its Project Blueprint collaboration with comScore and ESPN. The Project was an effort to develop a cross-platform audience measurement system to compete with Nielsen's independent efforts in that area. With some fearing that Nielsen would just shutter this potential competition, the FTC indicated that Nielsen would need to commit to market the LinkMeter technology to all comers in order to have the merger pass anti-trust review.
Nielsen seems to have gone one step further, announcing recently that it will divest itself of the LinkMeter system by selling it to comScore - one of the original collaborators and Nielsen's strongest competition in online media metrics. The move should keep the efforts to develop a consensus crossplatform metric competitive for the time being.
Source - Nielsen Finalizes Agreement To Sell Arbitron LinkMeter To comScore, Fulfills, FTC Antitrust Order, Media Daily News
Nielsen seems to have gone one step further, announcing recently that it will divest itself of the LinkMeter system by selling it to comScore - one of the original collaborators and Nielsen's strongest competition in online media metrics. The move should keep the efforts to develop a consensus crossplatform metric competitive for the time being.
Source - Nielsen Finalizes Agreement To Sell Arbitron LinkMeter To comScore, Fulfills, FTC Antitrust Order, Media Daily News
Monday, September 23, 2013
FTC clears Nielsen-Arbitron deal
The FTC has approved Nielsen's acquisition of former audience metrics rival Arbitron, after securing an agreement that Nielsen will continue the "Portable People Meter" (PPM) project, and license its use to others (notably competitor comScore). The PPM project was originally a joint project of Nielsen, Arbitron, and comScore, and there was some concern that Nielsen would try to freeze out comScore. ComScore and Nielsen are also involved in the competition to develop industry standards for online video metrics.
“In the event that an FTC-approved third-party elects to agree to licensing terms and other requirements, Nielsen would make available for license Arbitron PPM and related data as well as software and technology currently being used in the ESPN project for the sole purpose of cross-platform measurement for up to eight years,” Nielsen said in its statement.While that wording sounds awfully restrictive, other language from the FTC indicated that comScore would clearly get that initial license.
With the FTC's approval, Nielsen's acquisition of Arbitron is expected to close Sept. 30.
Source - FTC Clears Nielsen-Arbitron Deal, comScore Retains PPM License, MediaDailyNews
Friday, November 2, 2012
New Highs for Web Ad Revenues
A new report from IAB (Interactive Advertising Bureau) shows continued double digit growth for online advertising in the first half of 2012. The report indicates that U.S. online advertising totaled just over $17 billion for the first six months of 2012, up 14% from last year. Mobile ad revenues led the pack, up 95% to $1.2 billion, search revenues were up 19% to $8.1 billion, video ad revenues up 18% to just over $1 billion, while display $5.6 ad revenues growth slowed to 4% ($5.6 billion). In contrast, classified, rich media, and lead generation advertising categories all saw their share of online ad revenues decline.
“This report establishes that marketers increasingly embrace mobile and digital video, as well as the entire panoply of interactive platforms, to reach consumers in innovative and creative ways," said Randall Rothenberg, President and CEO, IAB. “These half-year figures come on the heels of a study from Harvard Business School researchers that points to the ad-supported internet ecosystem as a critical driver of the U.S. economy. Clearly, the digital marketing industry is on a positive trajectory that will propel the entire American business landscape forward.”The report shows that the online ad business remains highly concentrated, with the top 10 ad-selling companies getting 73% of all online ad revenues (the Top 50 get 90%). This level of concentration is mitigated somewhat in that most of those top 10 are ad-networking services that aggregate ad sales and placement for large numbers of websites and web services.
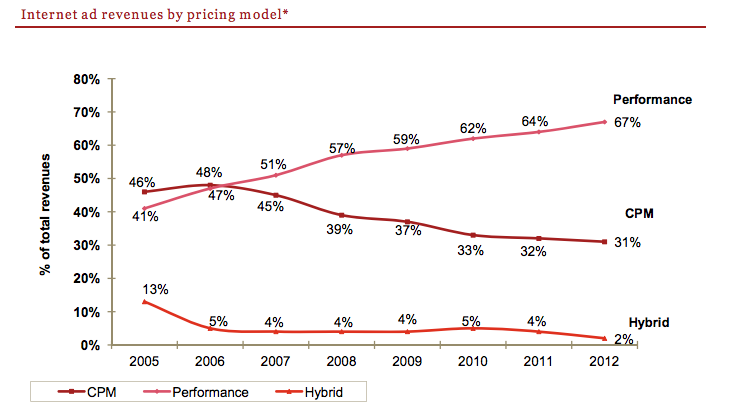
As the industry continues it search for acceptable audience and advertising impact metrics, the IAB differentiate among three basic models used to determine online advertising prices. Performance-based pricing models focus on ad-specific online use metrics, and has been the most widely used approach since 2006. The current report shows continued growth in this segment - to the point where it accounts for two-thirds of U.S. online ad revenues. CPM-based pricing models mirror traditional ratings and circulation approaches by basing value on the size and makeup of the audience for the online sites and services that host the advertising. The share of revenues based on CPM-based pricing models has been falling since 2006, accounting for 31% of online ad revenues in the first half of 2012. The share of online ad revenues generated through Hybrid-based pricing models (which use some combination of the other two) fell to 2% in 2012, after holding roughly steady at 4-5% since 2006.
Sources - Web Ad Revenues At $17 B in First Half Set Record, Research Brief blog
IAB internet advertising revenue report: 2012 first six months' results, full IAB report
Thursday, October 18, 2012
Measurement Issues: Online, Social, & RTB/Exchanges
This seems to be a good week to write about metrics - measuring audiences and/or media use. I posted yesterday about Nielsen's plans to use audio code readers and STB (Set Top Box) data from cable and satellite services to try to get a fuller sense of today's TV viewing behaviors, and a few days ago about Billboard revising how it measures a song's popularity in their Top 100 song charts. In this post, I'll try to highlight some other news and discussion of metrics.
Measuring media use has always been a bit problematic - but in the old world of media silos, media and advertisers were able to eventually agree on standard measures. Audited circulation numbers for newspapers and other print media, ratings and shares for broadcasters - none were perfect, but with a bit of back and forth between media and advertisers, a general consensus was reached on specific formulas for calculating media use that were considered valid and reliable enough to be useful. Reaching consensus was helped by the limited number of options available for consumers to access the content.The rise of digital networks and growth of media outlets disrupted things - increased competition fragmented audiences, making accuracy in measures more critical. To illustrate, in the 1960s programs on the big three broadcast networks would see primetime programs getting ratings in the 20s - a typical night might see shows with 25, 22, and 19 ratings competing and those 2-5 point differences were well outside standard measurement error - while this fall's network premiere week saw the top network primetime programs earn ratings in the 2.5 to 3.1 range (and 1.9 ratings considered a flop) with the result that critical decisions on buying advertising and/or cancelling programs are based on differences of a single ratings point or even tenths of a ratings point. While improved methods have reduced sampling and measurement error a bit, a lot of ratings based decisions today are based on differences that are statistically insignificant.
The growth in media outlets and convergence of content markets created another problem. With much content being accessible through multiple outlets, and with users also having the options of time-shifting or place-shifting, two critical issue for metrics emerges: which of these alternative uses should count, and can you develop measures that are comparable across the range of options?
Consider a relatively simple case - a daily local newspaper that also puts stories online. You have the ABC circulation numbers of how many papers were sold (and presumably read) that day. And metrics abound on the Internet, so it's easy to count how many times the online paper's site was accessed; you could also count how many "unique" site visits have occurred. But online new use is different than print - with print you can argue that subscribers and purchasers at least scan a large part of the paper. But the online news reader may look only at a couple of specific pieces of information - weather forecast, a favorite columnists latest piece, etc. Is accessing something on a newspaper website the equivalent of a sold copy? And if you approach metrics from the advertiser's perspective, they want to know how many people saw their ad. Should web use count if their ad isn't on the website?
Another issue is the web itself - which on one level can easily measure certain things - page downloads, unique visitors, click-throughs, posts, ad nauseum. But none directly get at the real question - what the web user did with it.
So you can understand that there's a lot of questions these days about who and what should be measured - and a lot of push from both media and advertisers/marketers to develop ways of measuring audience consumption, use, and impact of various types of content.
The Nielsen and Billboard posts talk about ways of expanding metrics to include new forms of consumption - Billboard adding online sales and plays on streaming services to the traditional radio airplays; Nielsen's audio code reader providing a mechanism to capture second screen viewing (among other things). But there's still a lot to work on with respect to online media use metrics
Gail Belsky has a piece on OMMA (a news blog covering online marketing and advertising) that considers a rising issue in the online video market - the lack of standard metrics. Online video use is booming, as is online video advertising - but many advertisers are hesitent to enter the market without reliable metrics and standards that let them directly compare online video viewing with traditional TV viewing.
(Online video viewing) still lacks uniform ROI metrics to compare it to TV — a concern even for pioneer online advertisers. “At the end of the day, it’s really about measurement,” says Greg Milner, director of global interactive marketing at computer maker Lenovo. “Is your ad working or not?”Surveys of advertising and marketing executives suggest most feel that developing consensual and reliable metrics are important for future development of the online advertising market. For now, some potential advertisers are satisfied with online advertising's ability to reach highly targeted market segments, and the ability of online video to create a "viewing experience" and promote engagement. For the mobile advertising market, there is also concern about whether the small screen can deliver the same impact. But for many others, the lack of a uniform metric comparable to those in traditional media makes contribute to uncertainty as to the relative value and impact of online advertising - even if they're convinced that they need to be in the online market. So for now, many find themselves testing the waters with small buys.
“It’s an environment where viewership is,” says Sacerdoti (CEO of video advertising network BrightRoll). “Advertisers should be present and testing that environment. There’s absolutely no doubt that if you’re a top 200 advertiser in tv, you should be testing mobile.”Meanwhile, over at GigaOM, Mark Ingram looks at metrics for social media. More specifically, he notes that media outlets and the firms using advertising and marketing through media, are interested in how people got to that target site. Social media seems to be driving a lot of traffic today, but it's not that easy to monitor or measure the impact of social media. Alex Madrigal suggests that a lot of traffic and referrals prompted by social media posts come through means that most current web-analytics metrics toss into a catch-all category called "direct". The IP header used to direct online traffic can include various bits of metadata, including a referral tag from the originating source of the message.
There are circumstances, however, when there is no referrer data. You show up at our doorstep and we have no idea how you got here. The main situations in which this happens are email programs, instant messages, some mobile applications*, and whenever someone is moving from a secure site to a non-secure site.To illustrate his point, Madrigal used one metric from Chartbeat that broke the "direct" category into several subcategories, including one linked to social media use, and applied it to The Atlantic magazine's website (see piechart).
(Chartbeat) took visitors who showed up without referrer data and split them into two categories. The first was people who were going to a homepage (theatlantic.com) or a subject landing page (theatlantic.com/politics). The second were people going to any other page, that is to say, all of our articles. These people, they figured, were following some sort of link because no one actually types "http://www.theatlantic.com/technology/archive/2012/10/atlast-the-gargantuan-telescope-designed-to-find-life-on-other-planets/263409/." They started counting these people as what they call direct social.
Chartbeat's estimated that social traffic to media sites is significant - 17.5% of all referrals were social referrals (coming directly from a social media site, or were "dark social"). Only search engines generated more referrals (21.5%). But as much as 70% of those social referrals were "dark", and missed by many web metrics services, in the sense that they were not identified as social referrals. This dark social traffic comes from email, IM, chat apps, and a variety of other conduits, but are likely initiated by social media content.A third post from John R. Osborn on the Online Video Insider blog also points to the importance of resolving measurement issues. Osborn's focus is on the emergence of RTB/Ad Exchanges
- RTB standing for Real Time Bidding - where advertising inventory is pooled from a wide array of media outlets, and auctioned off just prior to the advertising slot (in contrast with upfront ad buys that occur weeks or even months in advance). The development of these exchanges offers significant opportunities for smaller media outlines (particularly those online) to tap into advertising and marketing revenue streams. It also opens opportunities for advertisers or marketers to react quickly to opportunities and events, and to aggregate highly targeted audiences without having to seek out and negotiate with individual outlets. The primary thrust of the post is that if these exchanges can capture some of existing advertising/marketing revenues, and develop added revenue from small firms and organizations who aren't in the traditional markets, the revenue potential could make ad-revenue business models viable for the smallest of online video outlets.
The key to the long-term success of this advertising market segment (and thus its viability as a significant component of media outlet business plans), is developing a common basis for measuring ad exposure and establishing consensual price/performance measures that are comparable to other advertising formats and markets. As Osborn notes,
Many players are focused on development of a common buying currency, (sometimes called “digital GRPs”) to help accelerate the use of RTB and video ad exchanges.Furthermore, if that can be done, the ability to get near real-time metrics with online media and ads can provide RTB/Exchanges with a serious competitive advantage compared to upfront buys, by reducing uncertainty about actual audience size, demographic make-up, and current interests/focus.
Advertiser value will increase as constant, real-time feedback and adjustments get the message in front of the right audiences in the right context at the right time.
Development of these exchanges provides a number of opportunities for both online media outlets and content providers, and advertisers and others interested in reaching their targeted audiences with their own message. Furthermore, the fact that these Exchanges promotes on-the-fly aggregation of both outlets and advertisers opens the way for many smaller-scale outlets and individuals on both the supply and demand side to get into, and benefit from, the rapidly growing online advertising market. A recent study from Index Platform found that about half of advertisers and publishers are already testing RTB/Exchanges. The study also suggested that their greatest concerns were essentially about metrics - buyers wanting transparency and reliable measures of audiences; publishers wanting to assure better that the ad value coming from RTB is comparable with other sources. They also argued that developing a market-wide consensus on metrics, values, and practices would promote growth of this market segment. While most thought RTB revenues would grow, there was an common underlying perception that developing commonly accepted metrics will be critical for this aspect of the market to fully develop.
Each of the posts raises and discusses some interesting issues about the inadequacy of current metrics for online content and outlets. All are worth a closer read.
Sources - Video Goes Godzilla, OMMA blog
Dark social: Why measuring user engagement is even harder than you think, GigaOM
Dark Social: We Have the Whole History of the Web Wrong, the Atlantic
How RTB Video Exchanges Will Create a New T/V Business Model, OMMA blog
Real Time Bidding and Ad Exchanges: What works and what doesn't, report from Index Platform
Tuesday, September 25, 2012
A Guide for Measuring Mobile
Advertisers want to know who their ads are reaching, so they can evaluate the cost-effectiveness of different types of media or messages. The lack of widely accepted metrics for online and mobile audiences has hampered the acceptance of those media as conduits for advertising campaigns - so there are continuing efforts to develop metrics for analyzing reach and impact, and building consensus within the industry as to their viability and validity.
“This paper establishes the groundwork on how marketers can leverage mobile analytics, tap into the tools in the mobile toolbox and apply the data to not only evolve their mobile experience, but also evolve their entire marketing strategy,” said Mike Ricci, vice president of mobile at Webtrends and co-chair of the MMA’s Mobile Analytics Committee.It's a start, but it's not clear whether the various parties will buy into the MMA recommendations.
Sources - MMA Issues Mobile Analytics Guide, OnlineMediaDaily
MMA Primer on Mobile Analytics
MMA Paper on the State of Mobile Measurement (2011)
Tuesday, August 14, 2012
Two Posts on Big Data & Social Media
The Internet allows for the collection of immense amounts of information - on users, on outlets, and on content and its flows. Aside from continuing concerns about privacy issue, there's been a rise in the attempts to make sense of, and use, all this constantly-generated "Big Data." Furthermore, the rise of social media, and its transparency, is creating huge amounts of comments, thoughts, recommendations, of millions of users - as well as their follies and foibles - all of which can be mined for data.
We've clearly past the first stage - the explosion of information. That's been happening for decades, and the amount of information generated around the world continues to explode exponentially. We're also well into the second stage - developing tools and techniques for sorting, managing, and even filtering information. We're also in the early stages of developing analytics - the means to measure and analyze all that information (although measuring compounds the information explosion as it continuously creates new data about information and data). And that leaves us with the continuing problem of making sense and finding value. We're making inroads, but have yet to fully step into the third wave - using all those tools to find value in the information haystack.
Dion Hinchcomb, posting at The Brainyard, argues that
the social world, by dint of a billion people engaging with each other around the clock, is now the richest source of open innovation, product ideas, marketing and sales opportunities, customer care capacity, and much more. One thing we've learned in the last eight years of the mass collaboration era is that, whatever an organization cares about, crowds can help us conceive of it, build it, test it, market it, support it, and fix it--and do all of that at scale.The problem's been to find the gems or spot the trends in this morass of information and data. Thankfully, there's been a lot of people and companies working to develop analytics and techniques to sift and sort Big Data. This has opened Pandora's Box - a potential of finding value for Big Data users, as well as the potential for harming social media and Internet users. Hinchcomb focuses on the positive, positing that Social Media's Big Data can generate positive returns on organization's investment in utilizing and analyzing social media. Hinchcomb suggests that we're well past the first wave - that organizations are finding and making use of social media.
With the continuing rapid growth of social media, Hinchcomb suggests that some organizations will transition to social businesses. In an information economy, knowledge workers recognize the benefits of the opportunities the Internet and social media provide - greater access to information, enhanced opportunities for collaborations beyond your own "silo" of expertise/focus, and the ability to focus on project-related tasks. Particularly if enterprises can transcend internal barriers, such as embedded legacy enterprise-specific applications. Still, the fairly rapid adoption of social media provides hope that we'll make the transition.Still, it's not all blooming roses out there in the world of Big Data. At a recent Kontagent Konnect user conference, Josh Williams talked about the "Seven Deadly Sins of Data Science." As with any analysis, you can do it well, or poorly (particularly if you don't understand the limits inherent in any analytic technique). Here's some of the possible ways to mess up.
- Sloth - Lazy Data Collection: Also known as GIGO (garbage in, garbage out), the first limit on analysis is the quality of the data. It's easy to grab and use numbers that are there, rather than the numbers that you need.
- Negligence - Misapplied Analysis: It's easy to use an inappropriate technique - one that doesn't provide relevant results. (An example from one of my first stats classes - "The average American is 47% male and three days pregnant." Think about it.)
- Gluttony - Too Many Reports: Too much information and too many tools can result in too much analysis - and the key results can get lost in the mix.
- Polemy - Data Definition, User Disagreements: One of the problems with "Big Data" at this stage of development is that there are few widely-accepted metrics or analytics, which contributes to arguments over the definition and utility of data measures and procedures.
- Imprudence - Jumping to Conclusions: When you have a lot of data and a lot of results, it's easy for something to jump out and seem significant. Stats people will remind you that even at 95% confidence level, there's a 1 in 20 chance of a false positive (i.e., what you see isn't really there). If you place too much importance on a single finding, without examining the broader context, definitions, or limits of measures, you could be making a big mistake.
- Pride - Decision-Driven Data Making: If you look at Big Data to confirm your beliefs, it's easy to construe or manipulate things, even subconsciously. You might define things a certain way, pick supportive data, manipulate datasets - all of which might bias the analysis to foster confirmation. The true scientist looks for answers rather than confirmation, and is more likely to get to the truth (or reality or whatever).
- Torpor - Learning and Acting Slowly: Historically, data and analysis have been delayed - collecting, publishing, and analysing data took time (in academia you can easily have delays of 1-2 years in getting results out and being able to apply them). However, the Internet, social media, and Big Data are all racing in real-time. Being successful there requires collecting and examining data in real time, and being able to react to what you see happening quickly. A delay can put you on the wrong end of the trend.
Sources - Why Big Data Will Deliver ROI for Social Business, The Brainyard
The Three Waves of Enterprise 2.0: Climbing the Social Computing Maturity Curve, ebizQ
Social business holds steady gap behind consumer social media, ZDNet
7 Deadly Sins of Big Data Users, Information Week
Monday, April 2, 2012
Tablets as Advertising Medium
Post contributed by Ashley Logeman -
The amount of time people spend on tablets is ridiculous. Tablet advertising is still a new concept, because advertising agencies are having a hard time measuring traffic. Should tablet users be compared to smartphone users, television users, or online users? According to AllVoices, “Tablet owners are far more likely to tap on an ad compared to smartphone users. Approximately 24 percent of tablet users and 11 percent of smartphone users clicked an ad on their device to learn more about the product.” Tablets are more like portable computers, though, right? So what should advertisers expect? Should tablet advertisement be simply “added value” before metrics can prove anything? Interactive and rich media advertisements are much more effective than traditional advertisements, but media buyers want the number-crunching evidence.
Sources - Tablet advertising: Which metrics matter? Ellie Behling's Blog on eMedia/Vitals
State of Smartphone and Tablet Advertising, All Voices
------------------------------------------------------------------------------------
The explosion of tablet adoption and use certainly makes it a medium that advertisers want to look at, even if at this point, like much online advertising, there's no clear-cut measure of reach or effectiveness. Still, there are enough tablet users out there that we're getting some idea of use and impact, and two aspects may prove very desirable for advertising. First, that tablet users consume media differently on tablets than virtually any other device, and part of that comes from the ease and immediacy of interactivity on tablets (reflective in the greater tap-though noted above). Second, that tablet use is also highly social, and traditional media outlets are seeking to use that to build stronger relationships with consumers. That can mean more reliable and highly targeted audiences for tablet advertising.
These are strong reasons to consider advertising on tablets, and to creating tablet-specific ads that exploit their distinctive feature set and usage patterns. Still, advertisers have an ever-increasing choice of outlets for their ads, and they want to use whichever is most cost effective. And that means having widely accepted, reliable, and valid metrics for reach and effectiveness.
---Benjamin Bates
Thursday, March 22, 2012
Billboard Hot 100 lists to count on-demand streaming
Billboard's been tracking the popularity of music for decades, first looking at sales, and then for some of their charts (like the Hot 100) adding in radio plays. Now, in recognition of the growth of on-demand music streaming, its going to factor those choices into the mix.
Specifically, Billboard is going to include information from the Nielsen BDS monitoring of streaming activity for its On-Demand Songs chart, and also factor those into its premium Hot 100 chart. With the rise of a number of subscription on-demand streaming services (like Spotify), and Cloud-based streaming from personal music collections, Billboard argues that this is a growing and significant component of the music market that can't be ignored if you're truly seeking to measure the popularity of songs and artists.Some numbers from the Nielsen BDS give an indication of how big music streaming is - in the first 70 days of 2012, more than 4.5 billion audio streams were tracked, growing to a record 625 million ilast week. Compare that to the average 2.5-5 million online song purchases per week during 2011.
"The methodology behind all of the Billboard charts is ever-evolving to incorporate new technologies and the emerging ways consumers listen to and buy music" said Silvio Pietroluongo, Billboard's director of charts. "Accounting for an interactive medium such as streaming, both in the Hot 100 chart and the On-Demand Songs chart, provides an even more accurate gauge of the songs that are truly the most popular in the country."Of course, not everyone is happy with the move - mostly feeling that on-demand metrics might dilute current radio plays and sales numbers with older favorites. On the other hand, I'm old enough to remember that Pink Floyd's Dark Side of the Moon remained on Billboard's weekly Top LP chart for 15 years, without much complaint from music companies or the radio industry. Besides, Billboard's got lots of charts, and most don't include on-demand streaming... yet.
Still, Billboard's creation of new focused charts and inclusion of on-demand streaming in its Hot 100 chart can be seen as a recognition of the growth and impact of this newer distribution system for music..
Source - Hot 100 Impacted by New On-Demand Songs Chart, Billboard
Tuesday, March 6, 2012
Social Media for Marketing
Budgets for social media efforts continue to rise, as more firms recognize the potential of social media to contribute to promotional activities, and to help build relationships with consumers. But bottom-line managers wonder if those efforts are paying off. Which leads to the question of how does one measure the impact or effectiveness of social media efforts.
In a post for the OnlineSpin blog, Jason Heller takes a look at this "Return on Investment" issue.
He starts with stating that there are four basic objectives for social media efforts - building relationships with customers, creating awareness and acquiring new customers, providing customer service, and monitoring customer input for better insights and research they can act on. In the absence of industry-adopted specific metrics designed for social media arrive, Heller suggests that a combination of more generally accepted measures of impact and effectiveness can provide indications of effectiveness of at least those broad goals and objectives. Specifically, he suggests looking at Reach & Growth, Engagement, and Traffic & Commerce. Tracking Reach, particularly over time, reflects the ability to generate at least minimal interest and growth in reach reflects a growing potential customer base. Engagement, or looking at repeat or regular use, or interactions with social media audiences, reflect the development of stronger relationships. Traffic & Commerce metrics can be used to look at the impact of specific campaigns or efforts. You can track the insights and research efforts generated. While these aren't likely to confirm that social media efforts paid for themselves (what traditional business ROI looks for), they can provide at least some objective indicator of the effectiveness and impact of both general social media efforts, and the impacts of specific strategies and campaigns. As Heller concludes -
In a post for the OnlineSpin blog, Jason Heller takes a look at this "Return on Investment" issue.
He starts with stating that there are four basic objectives for social media efforts - building relationships with customers, creating awareness and acquiring new customers, providing customer service, and monitoring customer input for better insights and research they can act on. In the absence of industry-adopted specific metrics designed for social media arrive, Heller suggests that a combination of more generally accepted measures of impact and effectiveness can provide indications of effectiveness of at least those broad goals and objectives. Specifically, he suggests looking at Reach & Growth, Engagement, and Traffic & Commerce. Tracking Reach, particularly over time, reflects the ability to generate at least minimal interest and growth in reach reflects a growing potential customer base. Engagement, or looking at repeat or regular use, or interactions with social media audiences, reflect the development of stronger relationships. Traffic & Commerce metrics can be used to look at the impact of specific campaigns or efforts. You can track the insights and research efforts generated. While these aren't likely to confirm that social media efforts paid for themselves (what traditional business ROI looks for), they can provide at least some objective indicator of the effectiveness and impact of both general social media efforts, and the impacts of specific strategies and campaigns. As Heller concludes -
Focus on modeling the economic impact of engagement, scale and insights over time. Continue to demonstrate an increase in actively engaged consumers over time, and you will continue to gain executive support, which is a vital component of social media success. Just remember that eventually you will need to be able to support the economic argument.Source - A Push Toward Social Media ROI, OnlineSpin, a MediaPost blog
Thursday, January 5, 2012
Big Data and Journalism
With the rise of cheap computing and data storage has come the ability to measure and store huge amounts of data. What's coming along a bit more slowly is the interest in, and ability to make use of all of that data. Another jump in the ability to make use of all that info came with distributed computing - first with standalone projects like SETI@home, which used the processing power of millions of home computers to process billions of pieces of data (2 billion so far), and now the ability to harness the thousands of virtual computers in the Cloud.
So what is Big Data and what does it have to do with the future of journalism? The "Big Data" concept refers to the tools and processes for managing and using large datasets. The idea of data-driven journalism, has been around for decades, but for the most part been limited to focused use of datasets to answer specific questions. And, quite frankly, it's been severely limited by most journalist's seemingly inherent antipathy to numbers and math, as well as the decline in investigative journalism.
More recently, the concept of database journalism has emerged. Unlike data-driven journalism, the idea of database journalism is to aggregate the materials collected by journalists into databases, which can then be used to spot trends or provide local illustrations for local versions of stories.
Neither of these fit the idea of Big Data, however. What the Las Vegas Sun is doing with data may qualify, though - they exploit the massive amounts of audience metric generated by their online edition to suggest coverage, link to public databases to generate real-time informational maps of things like police reports, real estate listings, and retail hours for local editions, and used public and online databases to research a story on local healthcare.
But there is the potential for much more - particularly in today's age of big data and huge document dumps (often designed to hide the big stories from easy access). Only traditional journalism hasn't had a lot of interest in, or ability to exploit, Big Data. From various Wikileaks dumps to the release of Stimulus-funded projects data, to Sarah Palin's emails, journalists have let others do the analysis and largely just reported what they were told (if they reported it at all). That's a shame, because there is an unprecedented amount of publicly available information on government activities at all levels, campaign contributions and links between big money and "independent" public interest groups that should make a "watchdog" press drool. Not to mention how monitoring search engines and social media could alert journalists to emerging issues and hot topics. (For example, Google does a faster and better job of tracking flu outbreaks than the CDC, simply by monitoring searches for "flu remedies" and "flue symptoms.").
If journalism is to have a future, they need to do more than simply report what others say and do - they need to originate news, add value to stories, and reveal the needle in the haystack. And doing that through Big Data, through the use and analysis of available information, is becoming easier and cheaper. Will journalists acquire the interest and skills to do so, or will they leave that to others? (and in doing so render themselves even more irrelevant).
Source - Big Data: Why All the Fuss? InformationWeek Global CIO
So what is Big Data and what does it have to do with the future of journalism? The "Big Data" concept refers to the tools and processes for managing and using large datasets. The idea of data-driven journalism, has been around for decades, but for the most part been limited to focused use of datasets to answer specific questions. And, quite frankly, it's been severely limited by most journalist's seemingly inherent antipathy to numbers and math, as well as the decline in investigative journalism.
More recently, the concept of database journalism has emerged. Unlike data-driven journalism, the idea of database journalism is to aggregate the materials collected by journalists into databases, which can then be used to spot trends or provide local illustrations for local versions of stories.
Neither of these fit the idea of Big Data, however. What the Las Vegas Sun is doing with data may qualify, though - they exploit the massive amounts of audience metric generated by their online edition to suggest coverage, link to public databases to generate real-time informational maps of things like police reports, real estate listings, and retail hours for local editions, and used public and online databases to research a story on local healthcare.
But there is the potential for much more - particularly in today's age of big data and huge document dumps (often designed to hide the big stories from easy access). Only traditional journalism hasn't had a lot of interest in, or ability to exploit, Big Data. From various Wikileaks dumps to the release of Stimulus-funded projects data, to Sarah Palin's emails, journalists have let others do the analysis and largely just reported what they were told (if they reported it at all). That's a shame, because there is an unprecedented amount of publicly available information on government activities at all levels, campaign contributions and links between big money and "independent" public interest groups that should make a "watchdog" press drool. Not to mention how monitoring search engines and social media could alert journalists to emerging issues and hot topics. (For example, Google does a faster and better job of tracking flu outbreaks than the CDC, simply by monitoring searches for "flu remedies" and "flue symptoms.").
If journalism is to have a future, they need to do more than simply report what others say and do - they need to originate news, add value to stories, and reveal the needle in the haystack. And doing that through Big Data, through the use and analysis of available information, is becoming easier and cheaper. Will journalists acquire the interest and skills to do so, or will they leave that to others? (and in doing so render themselves even more irrelevant).
Source - Big Data: Why All the Fuss? InformationWeek Global CIO
Subscribe to:
Posts (Atom)