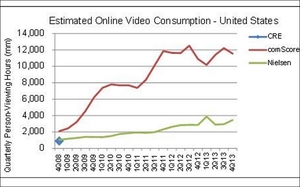
A report from Pivotal Research Group suggests a large and growing gap in measuring online video use. The study compared metrics from Nielsen with those coming from comScore, showing a sizable and growing gap in terms of online video usage between the two metrics. Currently, the estimates from comScore show roughly 3 times the amount of online video viewing as suggested by Nielsen's current proposed metric.
There are several reasons for the difference. One major difference is in how each defines "online video viewing": comScore includes both streams and downloads, and counts all video streams; while Nielsen only includes streams of TV programming. (Nielsen relies on embedded tags to measure TV viewing; Netflix, for example, strips all of those tags from the videos it streams, so Nielsen doesn't include any viewing from the dominant online video streaming service). Then again, Nielsen is funded by TV networks, stations, and broadcast advertising industry, so might be more conservative in measuring viewing that isn't ad-supported. comScore, on the other hand, is the primary metric used by online advertising industry, as it more directly counts viewing of online video ads. Neither metric currently includes viewing on the full range of mobile devices, however.
Based on numbers from the last quarter of 2013, comScore put online viewing at 8.6% of all TV viewing (15% among active online video users). Nielsen placed total online viewing at 2.6% (4.9% for active online video users).
Source - Report Reveals Gross Disparity In Online Video Ratings, Implies Overstatement, Online Video Daily

No comments:
Post a Comment