Social Media Week Infographics: The Big Players
Source - Pinterest, Twitter, Facebook, Instagram, Google+, LinkdIn - Social Media Stats 2014, AllTwitter
This blog is affiliated with a course at the School of Journalism & Electronic Media at the University of Tennessee, Knoxville. I'll try to use it to share relevant news and information with the class, and anyone else who's interested.
Monday, March 31, 2014
Friday, March 28, 2014
Social, Digital & Mobile Around the World (slideshare)
Milepost: 500,000,000 iPhones
Apple sold its 500 millionth iPhone recently.
When introduced in 2007, Steve Jobs predicted sales of 10 million by the end of 2008, and one senior financial analysts forecast that Apple would have "a difficult time" making it, pointing out that at that time, Nokia was selling more cellphones a week than Apple had sold iPhones. And thereby joining the gallery of famously bad predictions. In fact, Apple sold 13.8 million iPhones in 2008, and is currently selling a million iPhones a month, just in China.
While Apple is losing market share to Android in terms of mobile operating systems, their history of build quality, integration of components, and innovation suggests that iPhone's future remains positive. At the current rate, they should hit a billion units sold sometime in the next three-four years.
Source - Without Much Fanfare, Apple Has Sold Its 500 Millionth iPhone, Forbes
When introduced in 2007, Steve Jobs predicted sales of 10 million by the end of 2008, and one senior financial analysts forecast that Apple would have "a difficult time" making it, pointing out that at that time, Nokia was selling more cellphones a week than Apple had sold iPhones. And thereby joining the gallery of famously bad predictions. In fact, Apple sold 13.8 million iPhones in 2008, and is currently selling a million iPhones a month, just in China.
While Apple is losing market share to Android in terms of mobile operating systems, their history of build quality, integration of components, and innovation suggests that iPhone's future remains positive. At the current rate, they should hit a billion units sold sometime in the next three-four years.
Source - Without Much Fanfare, Apple Has Sold Its 500 Millionth iPhone, Forbes
Thursday, March 27, 2014
Pew: The State of American Journalism Revenues
It was the best of times, it was the worst of times, it was the age of wisdom, it was the age of foolishness, it was the epoch of belief, it was the epoch of incredulity, it was the season of Light, it was the season of Darkness, it was the spring of hope, it was the winter of despair, we had everything before us, we had nothing before us, we were all going direct to Heaven, we were all going direct the other way...Charles Dickens, A Tale of Two Cities
The State of News Media 2014 report estimates that the news industry in the U.S. generated around $65 billion in 2013. That figure combines advertising and subscription/sales revenues. To put that in context, global video game revenues are $93 billion, and Google had revenues of $53 billion. But is that good? Print's future looks increasingly dismal; broadcast's holding its own; but the online news world is generating more usage and revenues - and their revenues are growing rapidly. While online revenues are currently small compared to traditional revenue streams for news media. However, they are growing rapidly, even as digital opens myriad opportunities to develop new revenue streams.Key findings in the 2014 report:
- Advertising remains the dominant source for news revenues, accounting for roughly two-thirds of the total,
- Audience revenues is the other major source, generating about 25% of news revenues
- Alternative revenue sources and streams account for a growing share of news revenues. However, there contribution is small, with all other sources contributing just 8% of the total.
On the audience side, there are signs that traditional subscription payments are starting to decline. Traditional print circulation and subscription numbers are starting to fall, despite (or as a response to) increasing subscription costs. And while the newspaper industry is hoping that paywalls and digital subscriptions to online versions may recoup losses, a recent NAA study found that virtually all of the digital subscription gains in recent years come from 5 major newspapers. There are signs, on the other hand, that various media are finding revenues through content licensing, and repurposing content for distribution through alternative channels.
Wednesday, March 26, 2014
State of the News Media 2014 - Pew's annual report
The Pew Research Journalism Project has just released its annual State of the (US) News Media report for 2014. It's a big report with a lot of information, conclusions, and recommendations.
The report suggests that 2013 (and the early part of 2014) has seen the continuing transformation of the U.S. marketplace for news - on both the supply and demand side. It's seen an explosion in digital news outlets, "bringing technological knowhow and new money and luring top talent." It's seen the development of new and alternative revenue sources, the expansion of news into social media channels. As a result, the way people seek and consume news is changing; the report suggests that "the level of new activity this past year is creating a perception that something important, perhaps even game-changing, is going on."
The reports overview identifies six major trends:
Sources - State of the News Media 2014: Overview, report by PewResearch Journalism Project.
State of the News Media 2014 Complete Report
The report suggests that 2013 (and the early part of 2014) has seen the continuing transformation of the U.S. marketplace for news - on both the supply and demand side. It's seen an explosion in digital news outlets, "bringing technological knowhow and new money and luring top talent." It's seen the development of new and alternative revenue sources, the expansion of news into social media channels. As a result, the way people seek and consume news is changing; the report suggests that "the level of new activity this past year is creating a perception that something important, perhaps even game-changing, is going on."
The reports overview identifies six major trends:
- The expansion of digital news outlets is creating job opportunities, particularly in the form of international reporting.
- The new money and digital outlets "may be more about fostering new ways of reporting and reaching audience" than developing sustainable revenue streams.
- Developments in social and mobile are changing the dynamics of news production and consumption.
- The new digital forms are fostering "new ways of storytelling," but bring both promise and challenge.
- Local TV underwent massive change in ownership structures in 2013, with greater use of "shared content" in local newscasts.
- News outlets are just beginning to recognize the shifting demographics of U.S. audiences, primarily in the expansion of Spanish-language content and outlets.
Sources - State of the News Media 2014: Overview, report by PewResearch Journalism Project.
State of the News Media 2014 Complete Report
Monday, March 24, 2014
Web@25 - Graphics version
From Web Turns 25: 10 Graphics to See, Information Week -
Visualization of Website traffic
Social networking through Facebook
Web Health around the world
(Access, openness, content, empowerment)
Visualization of Website traffic
Social networking through Facebook
Web Health around the world
(Access, openness, content, empowerment)
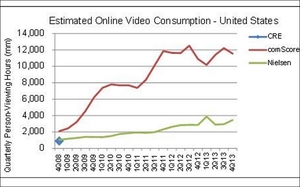
Metrics - Nielsen undercounting online video?
A report from Pivotal Research Group suggests a large and growing gap in measuring online video use. The study compared metrics from Nielsen with those coming from comScore, showing a sizable and growing gap in terms of online video usage between the two metrics. Currently, the estimates from comScore show roughly 3 times the amount of online video viewing as suggested by Nielsen's current proposed metric.
There are several reasons for the difference. One major difference is in how each defines "online video viewing": comScore includes both streams and downloads, and counts all video streams; while Nielsen only includes streams of TV programming. (Nielsen relies on embedded tags to measure TV viewing; Netflix, for example, strips all of those tags from the videos it streams, so Nielsen doesn't include any viewing from the dominant online video streaming service). Then again, Nielsen is funded by TV networks, stations, and broadcast advertising industry, so might be more conservative in measuring viewing that isn't ad-supported. comScore, on the other hand, is the primary metric used by online advertising industry, as it more directly counts viewing of online video ads. Neither metric currently includes viewing on the full range of mobile devices, however.
Based on numbers from the last quarter of 2013, comScore put online viewing at 8.6% of all TV viewing (15% among active online video users). Nielsen placed total online viewing at 2.6% (4.9% for active online video users).
Source - Report Reveals Gross Disparity In Online Video Ratings, Implies Overstatement, Online Video Daily
There are several reasons for the difference. One major difference is in how each defines "online video viewing": comScore includes both streams and downloads, and counts all video streams; while Nielsen only includes streams of TV programming. (Nielsen relies on embedded tags to measure TV viewing; Netflix, for example, strips all of those tags from the videos it streams, so Nielsen doesn't include any viewing from the dominant online video streaming service). Then again, Nielsen is funded by TV networks, stations, and broadcast advertising industry, so might be more conservative in measuring viewing that isn't ad-supported. comScore, on the other hand, is the primary metric used by online advertising industry, as it more directly counts viewing of online video ads. Neither metric currently includes viewing on the full range of mobile devices, however.
Based on numbers from the last quarter of 2013, comScore put online viewing at 8.6% of all TV viewing (15% among active online video users). Nielsen placed total online viewing at 2.6% (4.9% for active online video users).
Source - Report Reveals Gross Disparity In Online Video Ratings, Implies Overstatement, Online Video Daily
Tuesday, March 11, 2014
Goin' Mobile: In UK, mobile ad passes print this year, TV in 2017
A recent eMarketer research report predicts that advertising revenues for mobile media outlets will top 2 billion pounds this year, surpassing print newspaper advertising revenues. The study also forecasts that mobile ads will account for half of all digital ad revenues in 2016, surpassing TV advertising revenues. Mobile is slated to become the single largest advertising channel (by revenues) the following year.
The growth rate for digital and mobile ad revenues will continue to be at least double that of more traditional media throughout the forecast.
Source - UK mobile advertising set to overtake newspaper ad revenue in 2014, theguardian.com
The growth rate for digital and mobile ad revenues will continue to be at least double that of more traditional media throughout the forecast.
Source - UK mobile advertising set to overtake newspaper ad revenue in 2014, theguardian.com
Subscribe to:
Posts (Atom)