Monday, April 28, 2014

Social Media couldn't help NBC's Sochi ratings

Oh the wishful thinking at work.

NBCUniversal's head of research, Alan Wurtzel, recently commented on his unit's analysis of their Winter Olympics coverage earlier this year.  The extensive coverage of the Games (1500 hours, all told), provided a platform for investigating media behaviors.  The network had expected social media to have a "dominating" effect on viewership, driving viewers to both the main primetime broadcast network shows and the sports coverage spread across a number of cable channels.

As it turned out, viewing and social media use didn't explode as planned.  Only 19 percent of viewers used social media to post about the games.  Some 3 million unique users posted a total of 10.6 million Olympic-related messages on Twitter.  NBCU indicated that up to 23 million people saw one or more of those messages.  In contrast, NBC averaged 21 million viewers for its prime time coverage.  The numbers on Facebook were higher, but still only 20 million posted, commented, shared, or liked something "related to the Olympics."  NBCU didn't indicate what percentage were actually focused on their coverage of the games, or were positive posts on their coverage.  (I'll admit to retweeting and posting about some of their analysts' more ridiculous comments, as well as the comically unprepared venues and tourist facilities).

So out came the wishful thinking.  According to Wurtzel, social media wasn't "a game changer yet."
“A lot of people want to show that they are on the cutting edge... Why wouldn’t I want to say to you, ‘We have a potent new way in which we can drive ratings?’" But “it just isn’t true”, he added. “I am saying the emperor wears no clothes. It is what it is. These are the numbers.”
The underlying problem, though, is that people use social media to comment on things they find interesting, particularly things they are passionate about.  Social media activity is also mostly reactive.  Wurtzel and the head honchos at NBCU apparently thought that the world of social media would jump at the chance to provide free promotion for its Olympic coverage, generating the social buzz that would drive up viewership.  Particularly for its prime time shows, which focused more on soft stories of athletes than on sports coverage. 

However, there weren't a lot of U.S. athletes in those games that had active fan bases.  (The most social media savvy, Shaun White, did poorly after an injury.) Similarly, winter sports don't have the huge, and social media adept, fan base of many Summer Olympic sports.  From America's perspective, there wasn't much of interest to tweet about the actual sporting events, leaving social media to revel in the gaffes and general goofyness surrounding the event and its coverage.  And while that may drive social media traffic, its not the kind of buzz that can drive viewing and ratings.

The numbers certainly are what they are.  What's unclear is whether the numbers reflect the impotence of social media, or the impotence of NBCU's coverage of a mediocre sporting event.

Source -  Social media not yet a 'game changer' for boosting TV viewership,  Financial Times

Thursday, April 24, 2014

Mileposts: Two notable print closures

It's been a week of bad news for print media.  Newspaper revenues continue to slide, despite some upticks in digital subscriptions and advertising (see earlier post), and print's share of time spent with media has dropped more than 50% in the last four years, now accounting for a mere 3.5% of U.S. adult time spent with media (see previous post).  Now comes news that two notable print institutions are ceasing print operations.

Officials with publishing conglomerate Meredith Corp. announced today that the venerable Ladies Home Journal will no longer be published as a monthly magazine.  The title will transition to a special-interest quarterly publication sold exclusively at newsstands.  The Ladies Home Journal began publishing 131 years ago, and was the first U.S. magazine to reach a circulation of 1 million (111 years ago).  The company announced that the magazine's 3.2 million current subscribers will be shifted to other Meredith-owned publications.  Meredith indicated that its magazine division saw advertising revenue drop about 15% in the last year, while overall operating expenses rose about 8%, contributing to a 37% drop in profit levels.

The problem with the magazine was not its readers, but with advertising.  The number of ad pages had fallen 23% this year; but the problem was that that was only the latest of several years of double-digit declines.  Another of the pioneering "Seven Sisters" of women's service magazines, McCall's, closed in 2002 after years of losses that were also blamed on declining ad pages and aging audiences.  The last issue will bear a July 2014 publication date.

The announcement comes on the heels of the news that the Columbia University student newspaper, the Columbia Daily Spectator will drop its daily print edition.  Starting with the upcoming Fall term, the paper will be shifting its efforts to its online edition combined with a weekly print edition.  In fact, the new weekly edition will be folded into the Spectator's current weekly, called The Eye.  The Spectator began publishing as a student newspaper in 1877, and was the second-oldest continuously operating college newspaper in the U.S.  It began operating as a daily newspaper in 1902.

With this move, Columbia becomes the first (and so far only) Ivy League school without a daily student-run newspaper.  While stressing that it wasn't an economic decision, the paper's current Publisher did admit that the print edition was losing money this year, and hoped that the move would help free up funding to supplement a work-study program used to support staffers.

One alumnus, former managing editor Robert Hardt, Jr., commented that he had mixed feelings about the move:
“It’s the end of an era—but it probably means that Spec reporters will miss fewer classes and get better grades...”

Sources -  Ladies Home Journal to cease monthly publication, The Des Moines Register
 Ladies Home Journal to Fold After 131 Years in Print, Ad Age
Columbia student paper plans to drop daily print edition, Capital New York

eMarketer: Digital becoming most-used medium

A report from eMarketer indicates that the amount of time that U.S. Adults spend with media is increasing, and that the combined digital channels has overtaken TV as the medium that they spend the most time with.  The eMarketer report is based on a meta-analysis of some 140 studies from more than 40 research institutions.

The report indicates that U.S. adults spend an average of just over 12 hours a day with various media (the report counts each medium separately, even if the user is multitasking with other media).  If you look at individual channels, TV remains the medium adults spend the most time with (4 hrs, 31 min in 2013), but the combination of general online channels (PCs, laptops) and mobile (smartphones, tablets) is surpassing TV in time spent with media.  The report indicates that in 2012, the average total time with digital fell just shy of the average time with TV (by 7 minutes).  Print's downfall continues, with the average time spent with print media in 2014 projected to be only half of the time people spent with print in 2010, and its share of time spent with media dropping to 3.5%.  The decline is seen in both newspapers and magazines (slightly slower decline for magazines).

Interestingly, the growth in the amount of time spent with media appears driven by mobile.  According to the study, mobile is the only channel expected to consume more of users time, on average, in 2014.  The results didn't indicate whether the overall time gain was likely due to the continuing adoption of mobile media, increased usage by mobile owners, or some combination of factors.

The report also notes that in studies of time spent using media, that video consumption through digital channels remains small compared to traditional TV (in 2013, four and a half hours for TV, 44 minutes for digital).  Even there, however, all of the projected gain in usage in 2014 comes from the mobile sector, which eMarketer projects growing 50% in that year.

The report also looked at the amount of time U.S. Adults spend with social media, projecting that people will spend an average of more than an hour a day using social media.  In 2014, mobile usage overtakes online usage (average of 35 minutes a day for mobile, and 32 minutes a day for online).  Breaking down mobile, smartphones still dominate use over tablets.

Source -  Mobile Continues to Steal Share of US Adults' Daily Time Spent with Media, eMarketer

Monday, April 21, 2014

US Newspapers Revenues Still Falling

The Newspaper Association of America (NAA) has released its report on the state of newspapers in 2013.  The report trumpets "the best performance since 2006" - but that's because the overall revenue decline of -2.6% is the smallest annual percentage decline over that period.  Overall, the industry lost more than a billion dollars of revenue in 2013.  The fall in revenues was again led by a 8.6% drop in print advertising revenues.  According to the report, print advertising revenues account for less than half of total revenue.  Classified ad revenues continue to lead the decline (down 10.5%), but both national and retail advertising revenues fell by 8%.  Advertising revenues were also down (-5.8%) for weekly and niche publications.


Offsetting this was a modest 1.5% growth in digital advertising (overall, digital advertising is growing at a double-digit pace).  If there's good news in the report, it's the fact that the rapid adoption of paywalls for the online versions of print newspapers contributed to a modest gain in overall circulation revenues.  That, and the fact that the NAA managed to add $5.5 billion in additional revenues by including revenues from side ventures such as contract printing, weeklies, and a range of niche publications and services.  That really helped to slow the decline in the "total industry" numbers.  Still, revenues from all digital sources amounts to only 12% of total industry revenue, and newspapers' digital revenues continue to grow much more slowly than other forms of digital advertising.

Newspapers aren't out of the woods yet.

Sources -  Newspaper industry narrowed revenue loss in 2013 as paywall plans increased, Poynter
Business Model Evolving, Circulation Revenue Rising, NAA report\

(I made a number of edits for style and clarity after initial posting - BJB)

Tuesday, April 8, 2014

Brand Images of Cable News

According to YouGov's BrandIndex, the perceived brand image of the major cable news networks has remained fairly constant in recent weeks, despite the small jump in viewing linked to the missing aircraft story..  The BrandIndex Buzz Index compares consumer perceptions of brands, and looks at the net difference between positive and negative comments.

As the graph shows, only Fox News has generated a net positive "Buzz", and seems to have more consistent values (in the +4 to +6 range) in 2014.  None of the other measured cable networks generated a positive Buzz value over the measured time frame.  CNN's perception score seems to have bottomed out last June (hitting -17), before making it back to a -4 score in October 2013, with consistent fluctuations after that.  Consumer perceptions of CNN Headline have largely tracked those of CNN.  Consumer perception of MSNBC has been very consistent since the start of 2014, with scores in the -9 to -10 range.  That suggests the audience has pretty much made up its mind about MSNBC, and the network hasn't been able to do much to shake that overall negative impression.  Since many of the big swings seem linked to major news events, it might also suggest that MSNBC's specific coverage of news doesn't change viewers perceptions about the network.

Source -  Despite disaster coverage CNN perception declines,  YouGov BrandIndex report


A More Active Audience for TV

According to one recent analysis, delayed viewing (from DVR or VOD) is becoming the dominant form of primetime entertainment watching.  The Rentrack State of VOD report that delayed viewing was up 24% during prime time last year.  In 2013, some 43.2 million sets accessed a total of 4.4 billion hours of VOD content.  That works out to an average of 9 hours of VOD content a month per TV set.

But a better reflection of the change in audience TV viewing habits was the fact that 66% of the viewing of broadcast prime-time programming occurred more than 3 days after the original broadcast.  Delayed viewing is not concentrated to particular days; those watching On-Demand content did so on an average of 16-18 days a moth.  TV viewers, in the U.S. at least, are increasingly choosing when they watch their favorite programs.
"The consumer is utilizing the VOD button on their remote in a bigger way than ever, and TV networks have responded with their best programming," said Rentrak Chief Executive Officer and Vice Chairman Bill Livek.

Source:  Video-On-Demand Broadcast Primetime Viewing Grew 24% According to Rentrak's Newly-Released 'State of VOD' Report,  Market Watch

Monday, April 7, 2014

Recovery for World's Ad Economy

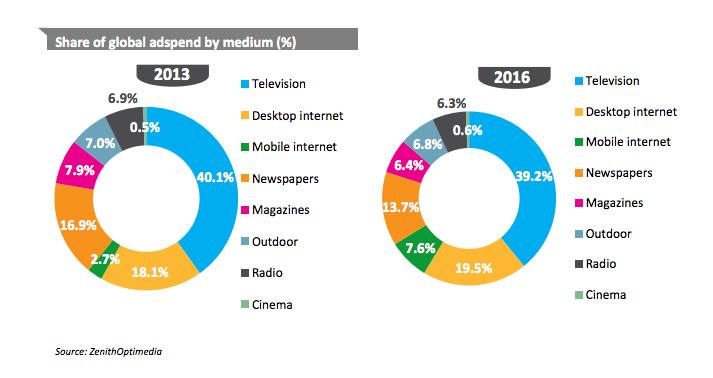
Recent estimates from ZenithOptimedia Group suggest that on a global level, at least, the advertising sector has returned to its pre-recession growth rates.  The report now forecasts a 5.5% growth in advertising spending, reaching a total of $537 billion. The news isn't uniformly positive for all media, however.
The overall growth is being driven largely by the rapid increase in online advertising.  Internet advertising is forecast to continue to grow by around 16% annually for the next few years, with online display growing at 21% and social media ad expenditures growing by 29%.   Online advertising can also be differentiated into desktop (static) and mobile sectors - and the report notes that the mobile sector is growing at 6 times the rate of desktop, hitting 50% annual growth through 2016.  The ZO researchers said, "mobile will leapfrog radio, magazines, and outdoor to be the fourth-largest sector" by 2016


While the TV sector continues to draw the lion's share of global advertising, and is forecast to continue growing, the online sector's much faster expansion is closing the gap.  The news is worst for print: both newspapers and magazines are losing ad revenues.
We predict internet  advertising will increase its share of the ad market from 20.7% in 2013 to 27.1% in 2016, while newspapers and magazines will continue to shrink at an average of 1%‐2% a year,” the report states. “Internet advertising overtook newspaper advertising for the first time in 2013, and we forecast it to exceed the combined total of newspaper and magazine advertising in 2015.”
The U.S. advertising market is forecast to continue its dominance of the global ad economy, but the report predicts that China (currently 3rd largest) will overtake Japan by 2016, while Indonesia and South Korea will overtake France and Canada among the ten largest ad markets.

Source:  Internet Ad Spend to Reach $121B In 2014, 23% Of $537B Total Ad Spend, Ad Tech Boosts Display,  TechCrunch.com

Thursday, April 3, 2014

Social Media Week Infographic: Impact on Job Hunt

Or, Should You Post Those Spring Break Party Blow-out Pics?

From The Role of Social Media In Pre-Employment Candidate Screening - Statistics and Trends, Go-Gulf.com


Social Media Week Infographic: Social Media and Music

From Social Sound Bytes, Churchm.ag


Social Media Week Infographic: Social Media Monitoring & Analytics


From The World of Social Media Monitoring And Analytics,  Digital Information World


Social Media Week Infographic: The Power of the Hashtag

From The Power of the Hashtag, AllTwitter


Social Media Week Infographic: Social TV

From Social TV: The Value of the Second Screen, AllTwitter


Tuesday, April 1, 2014

Social Media Week Infographic: The PR Social Media Zoo

From The Social Media Zoo,  PRWeb


Social Media Week Infographic: Social Ad Spending Forecast

From Social Ad Spending Forecast, Social Media Today


Social Media Week Infographic: Scary Stats

From Social Media Stats That'll Make Your Hair Stand on End!,  Digital Information World


Social Media Week Infographic: Are You Safe on Social Media?

From  Are You Safe on Social Media?, SocialMediaToday


Different Tablets, Different Uses

From the Wall Street Journal - a comparison of tablet uses.

What's interesting is that iPad and Galaxy tablets are used in pretty much the same ways, but Kindle Fire usage is different.  Actually, that's not really surprising - the Kindle Fire is optimized for consuming media content and other entertainment-related uses (like gaming).  So it's really no surprise that Kindle owners are twice as likely to use their tablets for reading e-books and playing games.  I wouldn't be too surprised that the Kindle did well with online video as well.

Source  - Data Point: People Really Like to Read on Their Kindle Fires,  Digits (Wall Street Journal blog)

Video's Goin' Mobile - And Sports Rule!

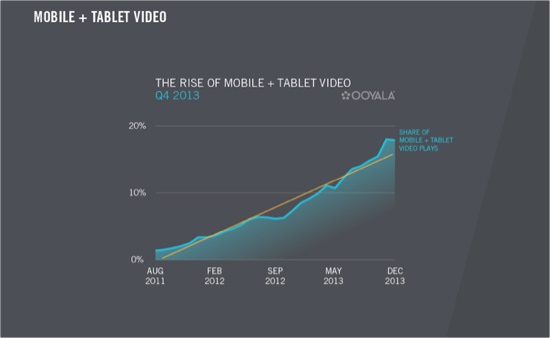
The latest Ooyala Global Video Index has some interesting findings.

“Widely doubted as a viable TV platform by critics less than a decade ago, mobile today is the fastest-growing segment of online video. It has been for the last two years, and will be for the next two.”
The viewing of online videos through mobile devices has grown 719% since 2011. It currently accounts for 18% of all online video usage worldwide, and Ooyala predicts mobile will account for half of all online video viewing by the end of 2016.  In a survey of publishers and broadcasters, almost all (99%) said reaching the mobile audience was "important", if not critical.  And 83% indicated they thought mobile video offered a strong potential for monetizing content and services.

And in time for March Madness, the report indicates that mobile viewers are three times as likely to watch live sports on their mobile devices than video-on-demand content.  Sports also dominates mobile viewing time, with longform sports content (10+ minutes in length) accounts for almost two-thirds of all mobile viewing time.  Turner Sports concurs, indicating in a recent press release that mobile (smartphone and tablet) viewing of its NCAA men's basketball streams was up 71% in the tournament's first two weeks.  Turner said the tournament had generated more than 64 million live video streams  - 13.5 million hours - over that period, already eclipsing the 49 million lives streams for the entire 2013 tournament. 

The Ooyala report is based on measuring the online viewing habits of more than 200 million Internet users in some 130 countries.

Sources -  Half of All Video Views Could Be  Via Mobile/Tablet By 2016, Sports Is Big Driver, Vidblog
Ooyala Gloval Video Index Q4 2013 report

Social Media Week Infographic: The Cost of Fake

From The Cost of Social Media Fame in 2014? About $6800,  Forbes


Social Media Week Infographic: The Cost of Fame

According to Forbes, The Cost Of Social Media Fame In 2014? About $6800