Despite the conventional wisdom that people won't watch commercials longer than 30 seconds, a new study by Invodo suggests that the length isn't as important to viewers as the content of the spot. If the spot is interesting, or provides useful information, viewers will spend more than 3 minutes with a spot. Spots that demonstrate how a product is used seem to be particularly valued - with viewers indicating that they will often watch those on multiple occasions, and helps them make a better buying decision.
Craig Wax, CEO of Invodo, concluded: "If anything, our research suggests that packing too much content into a shorter video may be a mistake. As long as the video is compelling and helps them make a purchase decision, most consumers are willing to absorb videos much longer than 30 seconds. Focusing on video content and quality will help brands drive business results."
Source - Length Doesn't Matter; It's What In the Video That Counts, VidBlog
Sunday, February 19, 2012

Twitter, Facebook, Addictive?
A new study published in the journal Psychological Science suggests that social media may be more addictive than alcohol or tobacco.
No, they're not talking about a physical addiction, but whether heavy social media users could refrain from using social media for a week. During that week, participants were asked, at random intervals, whether they had the urge to use social media, as well as urges to engage in a range of other activities. They also were asked if they gave into those urges, and whether the urges conflicted with other activities and desires. Respondents overwhelmingly reported having various urges during their responses, and it appeared that using social media was harder to resist that many other behaviors. The study's author, Wilhelm Hofmann, was quoted as saying
Still, I can see that some people may develop some degree of dependency for social media use, related to a need for connectedness. And dependencies are hard to shake. But I don't see any real suggestion that social media is any more or less "addicting" than any other habit, and is more likely to be driven by an underlying need than the behavior itself.
But make up your own mind.
Source - Twitter, Facebook More Addictive than Cigarettes, Alcohol, The Social Graf MediaPost blog
No, they're not talking about a physical addiction, but whether heavy social media users could refrain from using social media for a week. During that week, participants were asked, at random intervals, whether they had the urge to use social media, as well as urges to engage in a range of other activities. They also were asked if they gave into those urges, and whether the urges conflicted with other activities and desires. Respondents overwhelmingly reported having various urges during their responses, and it appeared that using social media was harder to resist that many other behaviors. The study's author, Wilhelm Hofmann, was quoted as saying
“Desires for media may be comparatively harder to resist because of their high availability and also because it feels like it does not ‘cost much’ to engage in these activities, even though one wants to resist. With cigarettes and alcohol there are more costs -- long-term as well as monetary -- and the opportunity may not always be the right one. So, even though giving in to media desires is certainly less consequential, the frequent use may still ‘steal’ a lot of people's time.”Now, there may be an important confounding factor here - to get responses at random intervals, participants were given a Blackberry, and gave their responses through that device. So each participant, at each inquiry, was using a device with social media capabilities in a way similar to engaging in social media, when asked about their desire to use social media. At the very least, this would seem to give social media urges a primacy and immediacy not found with the other urges being asked about (sports inclinations, sexual urges, spending impulses, smoking, alcohol consumption, etc.). That could bias responses.
Still, I can see that some people may develop some degree of dependency for social media use, related to a need for connectedness. And dependencies are hard to shake. But I don't see any real suggestion that social media is any more or less "addicting" than any other habit, and is more likely to be driven by an underlying need than the behavior itself.
But make up your own mind.
Source - Twitter, Facebook More Addictive than Cigarettes, Alcohol, The Social Graf MediaPost blog
App-y New Year
The rise of apps as a significant revenue source continued in 2011, and seems headed for even more explosive growth this year. The App Annie blog highlights 7 key trends in a creative new inforgraphic, Rise of the Planet of the Apps.
Source - Infographic: The Rise of the Planet of the Apps, AppAnnie.com
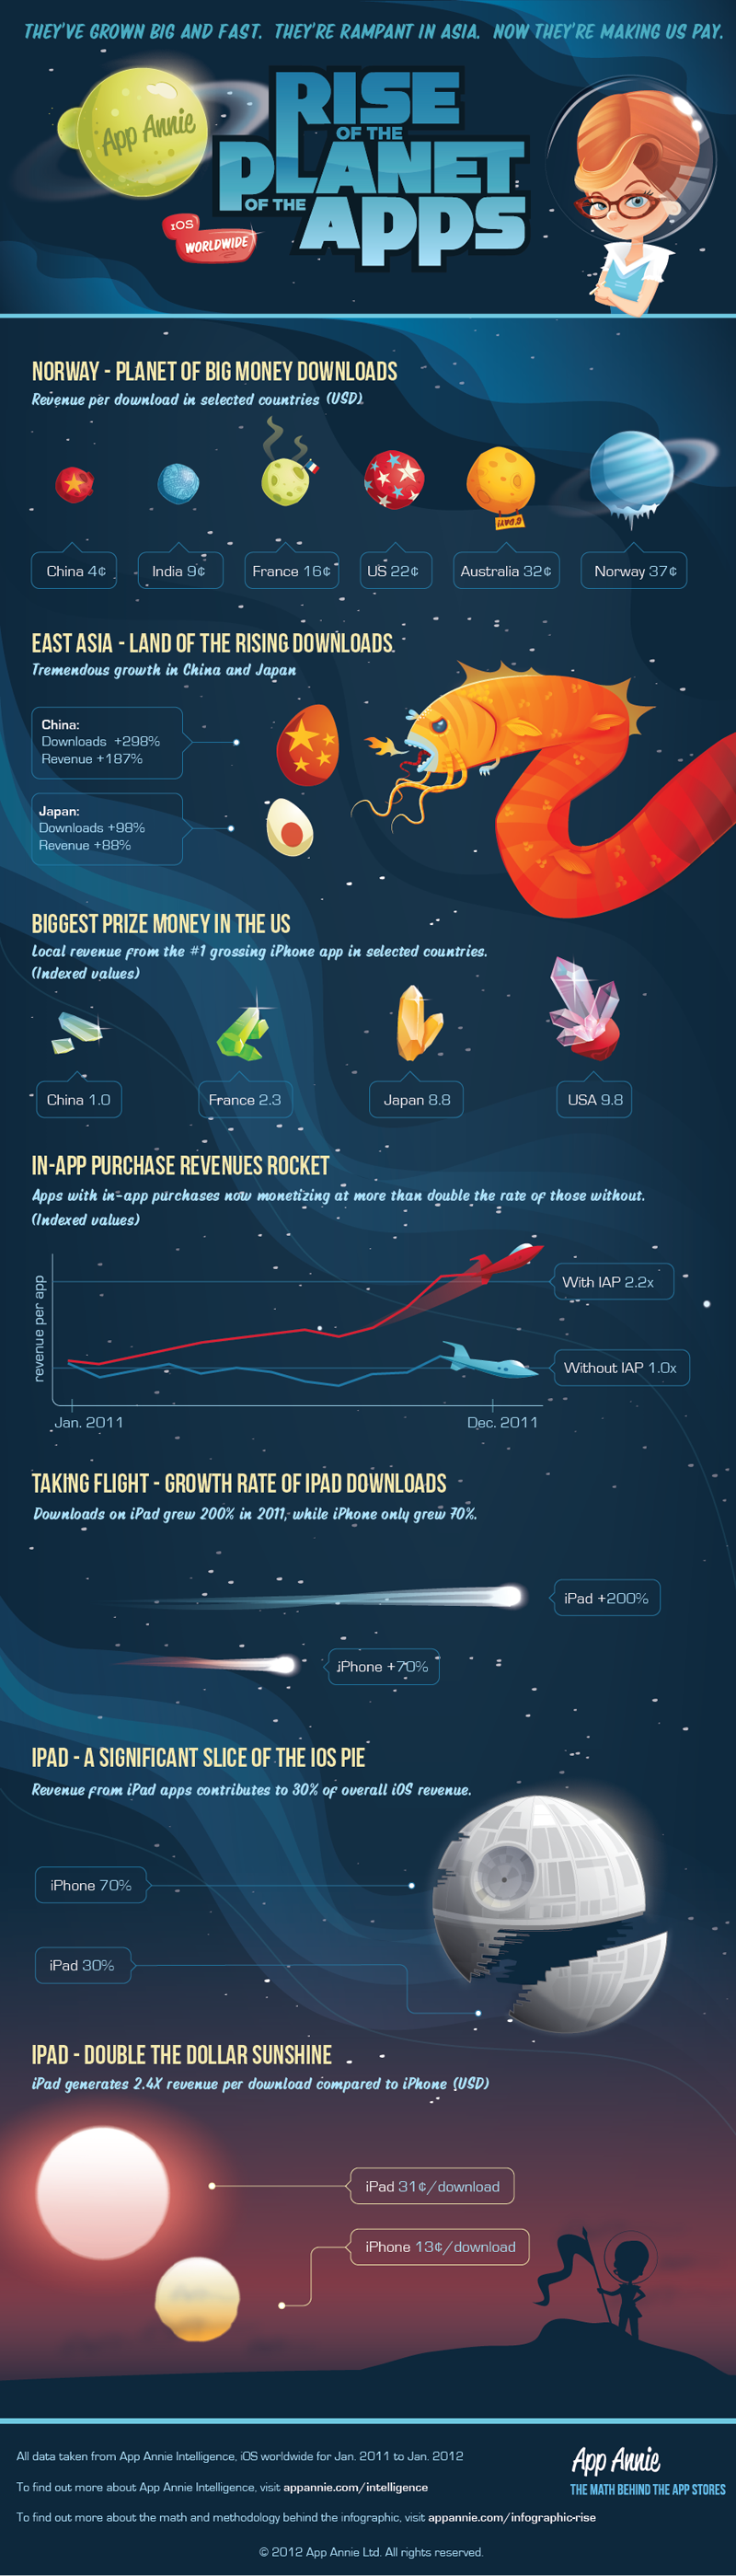
- East Asia - Land of the Rising Downloads - 2011 saw almost a three-fold increase in app downloads in China, and a 187% increase in app revenue. In Japan, downloads doubled in number, with an 88% increase in revenues. Look for international publishers to raise their game in understanding localization
- Norway - Planet of big money downloads. Norway leads in generating an average of $0.37 per download (vs. average $.04 per app in China). With only a loose correlation between GDP per capita and revenues per app, one needs to look at other factors, like smartphone penetration and local currency support.
- Biggest prize money in the US (and Japan). The top-grossing app in the US hauls in 10x the revenue of China's top app. On the other hand, the top grosser in Japan brings in revenues close to (90% of) the US top grosser, despite having only 1/6 the number of smartphone users.
- In-App Purchase (IAP) revenues skyrocket. At the start of the year, the top apps with IAP and those without were generating roughly the same revenues. By the end of the year, apps with IAP were monetizing more than twice as much
- Taking Flight - Growth of iPad downloads. Downloads for iPads grew 200% in 2011, compared to 70% for iPhones. Data suggests both notebook and smartphone users will convert to tablets.
- iPad - A significant slice of the iOS pie - Revenues on iOS platforms currently split 30% for iPad, and 70% combined for iPhone and iTouch.
- iPad - double the dollar sunshine. The iPad has a bit more than twice the number of pixels as the iPhone, but is generating an average of 2.4x more revenue per download. This suggests that there may be differences in how the two devices are used, and/or a willingness to purchase more expensive downloads for tablet use. It also suggests app design and development should go beyond scaling up image resolutions.
Source - Infographic: The Rise of the Planet of the Apps, AppAnnie.com
Friday, February 10, 2012
Gen Y and the Future of TV
New research on Gen Y media behaviors suggest a shift to wanting more control over their television viewing. The study, from Ideas & Solutions! Inc. sought to determine whether the recent increase in cord-cutting (dropping traditional TV delivery systems in favor of using the Internet as a source for TV programming) was a result of the weak economy, or if it indicated a shift in audience attitudes about TV viewing preferences. The study suggested that Gen Y members (those born between 1980 and 1995) tended to fall into one of four groups.
The study also found that those in the At Risk category were open to the idea that the implementation of the "TV Everywhere" concept could bring the level of customizability and control currently missing in multichannel and broadcast systems.
Source - Gen Y's Latest Trend: Cord Cutting, TVNewsCheck
- Loyalists - those who like and are satisfied with current program delivery systems. Fans of bundling, they like having all of their viewing options available from one source, and aren't likely to become cord-cutters absent a major change. About a third of Gen Y seems to fall in this category.
- Leaners - this group, while remaining tied to traditional TV outlets, have at least considered the possibility of switching to an alternative TV delivery mechanism, whether by shifting from bundled program delivery to a la carte subscriptions or by programming delivered through the net. The researchers felt that compared to Loyalists, they seemed more interested in convenience and control than costs or added features. This group currently accounts for 29% of Gen Y audiences.
- At Risk - accounting for 28% of the Gen Y audience, this segment has given serious consideration to cord-cutting. They strongly prefer the control over programming that a la carte and IPTV television delivery offers. They already watch video programming online, and are likely to have tablets, WiFi, and subscriptions to Netflix. They're also more likely to view cable or DBS as a luxury and are sensitive to cost increases.
- Nonsubscribers - one in five Gen Y's fall into this category, and consist of those who currently don't pay for television services. This segment can be further broken down into two groups - Evaders (those who have never purchased cable or DBS multichannel services, and Defectors, who have had paid TV subscriptions in the past, but have dropped those services. For both, the driving issue is whether they feel the costs outweigh the benefits they're likely to gain from having access to multichannel video services. A significant portion of Evaders simply don't see much value in television programming.
The study also found that those in the At Risk category were open to the idea that the implementation of the "TV Everywhere" concept could bring the level of customizability and control currently missing in multichannel and broadcast systems.
As one respondent observed, TV Everywhere "sounds like the link between the Internet and TV that I’ve been looking for.”At the very least, the results of this study suggest that cable TV and DBS marketers shouldn't continue their old view of passive audiences and marketing themselves with the traditional "it's TV with more channels" focus. As the report indicates, “Engagement strategies must be carefully tested because young consumer desires aren’t necessarily in line with business (models) of subscription-based pay TV companies today.”
Source - Gen Y's Latest Trend: Cord Cutting, TVNewsCheck
Net status report
The latest research report from GlobalWebIndex continues to show strong growth potential across a range of Web services and devices. The survey, based on a sample of 40,000 Internet users in 27 countries, shows strong and continued growth in social media use and e-commerce applications, as well as the continued dominance of Google across a growing range of services (85% of Internet users around the world report using one or more Google services at least monthly).
On the social media front, the recent report should that 60% of the sample managed a social media profile at least monthly, a significant improvement from 2009 (when only 36% used social media at least once a month). However, the survey also showed that Facebook seems to have reached a saturation point in mature markets, with their growth in subscribers being driven by expansion into markets like India, Indonesia, and Brazil. This survey also suggested that while remaining active, there's a small decline in the frequency of social media activities, particularly in the U.S.
E-commerce usage is also growing, with 59% of the global sample purchasing something online in the last month. Adoption and use of e-commerce applications remains centered in more heavily developed markets, at least for now.
Source - Internet Growth, e-Commerce Expands Globally, Online Media Daily
On the social media front, the recent report should that 60% of the sample managed a social media profile at least monthly, a significant improvement from 2009 (when only 36% used social media at least once a month). However, the survey also showed that Facebook seems to have reached a saturation point in mature markets, with their growth in subscribers being driven by expansion into markets like India, Indonesia, and Brazil. This survey also suggested that while remaining active, there's a small decline in the frequency of social media activities, particularly in the U.S.
E-commerce usage is also growing, with 59% of the global sample purchasing something online in the last month. Adoption and use of e-commerce applications remains centered in more heavily developed markets, at least for now.
Source - Internet Growth, e-Commerce Expands Globally, Online Media Daily
A Look at Kids' TV & Set-Top Box use.
A collaborative group that's looking into how to better measure TV viewing (or use) in a multi-device, connected, environment, took a small detour to look at what's happening in the world of Kids & TV. Pooling data from three different ratings sources over a 13 month period, they looked at several viewing metrics, and a variety of times of day. While there was some incompatability with the three sources, they were close enough to allow some general conclusions.
Source - Collaborative Think Tank Looks At Kids' STB Data, TV Board
- Viewing by kids is either shrinking or growing. In terms of ratings, kids' viewing declined slightly in the M-F daytime and Weekend afternoon dayparts, and more or less stable in Weekend mornings. Rentrak "impressions" showed slight gains in M-F daytime and Weekend mornings, and a smaller gain in Weekend afternoons. Their conclusion was that there was a slight overall shrinkage in the "children's network ecosystem."
- Nickelodeon's share of the Kids market is shrinking, slightly. The shift in viewing doesn't seem to be going to any one specific alternative channel.
- There was some concern that the lower numbers from Neilsen may be a result of changing sample demographics, rather than a reflection of general audience behaviors.
“We are glad that the kids are all right. Even though they have many opportunities for alternative media usage, linear TV remains strong. And depending on whose currency you use, Nielsen is only down slightly and Rentrak shows growth. More to follow."
Source - Collaborative Think Tank Looks At Kids' STB Data, TV Board
TV Broadcasters add Digital Channels
Research from SNL Kagan shows and increase of 80% in the number of digital TV offerings available from local TV broadcasters. Included in the count are HD channels, multicast channels, and mobile DTV channels. The research showed that by the end of 2011, there were 4552 digital channels being delivered by the 1726 full-power local TV broadcast stations.
Most of the increase comes from multicasting (stations can broadcast multiple channels as long as they fit within their assigned channel's bandwidth). The largest segment of these channels consist of some of the new channels being marketed as multicast networks, like Bounce TV, Live Well, AntennaTV, among others. Spanish-language multicast channels are a second big segment of the growth of added channels, doubling in the last year. A few stations are actually multiplexing two HD channels.
The report gives the TV broadcast industry some support in its efforts challenging proposed broadcast spectrum takeback. Most of the recent proposals call for about 40% of the remaining TV spectrum to be carved out and returned for auction to alternative users (much has already been returned to the FCC for other uses). Under those proposals, either as many as a 15-20% of existing stations would be silenced, or channel space would need to be reduced to keep most on-air. And in that case, stations would lose the ability to carry as many digital channels.
Source - Broadcasters Boost Digital Offerings By 80%, Broadcasting & Cable
Most of the increase comes from multicasting (stations can broadcast multiple channels as long as they fit within their assigned channel's bandwidth). The largest segment of these channels consist of some of the new channels being marketed as multicast networks, like Bounce TV, Live Well, AntennaTV, among others. Spanish-language multicast channels are a second big segment of the growth of added channels, doubling in the last year. A few stations are actually multiplexing two HD channels.
The report gives the TV broadcast industry some support in its efforts challenging proposed broadcast spectrum takeback. Most of the recent proposals call for about 40% of the remaining TV spectrum to be carved out and returned for auction to alternative users (much has already been returned to the FCC for other uses). Under those proposals, either as many as a 15-20% of existing stations would be silenced, or channel space would need to be reduced to keep most on-air. And in that case, stations would lose the ability to carry as many digital channels.
Source - Broadcasters Boost Digital Offerings By 80%, Broadcasting & Cable
Thursday, February 9, 2012
Tablets and Magazine Readers
New research results from a panel of tablet owners (GfK MRI's iPanel of tablet and eReader owners), shows strong interest in reading digital magazines.
In a survey taken last month, 71% of tablet owners reported having at least some interest in reading magazines on their devices. Some 38% had reported reading a magazine on their tablets in the last six months. In contrast with print magazines, there was stronger interest among men, and among the younger demographic. For the Male 18-34 segment, 85% expressed some or considerable interest in reading digital magazines.
Apps remain the dominant access point for digital magazines, with two-thirds of the tablet owners saying they got to the online magazine through an app (47% accessed magazine content through the magazine's website, and 37% read a digital reproduction (both content and ads). And yes, this adds to more than 100%, which indicates that some are reading more than one magazine on their device a month.
GfK MRI's also put together a short video on their digital magazine results.
Source - Tablets Attract Magazine Readers, Research Brief from the Center for Media Researh
In a survey taken last month, 71% of tablet owners reported having at least some interest in reading magazines on their devices. Some 38% had reported reading a magazine on their tablets in the last six months. In contrast with print magazines, there was stronger interest among men, and among the younger demographic. For the Male 18-34 segment, 85% expressed some or considerable interest in reading digital magazines.
Risa Becker, SVP Research at GfK MRI, says "The fact that younger men who own Tablets are interested in reading digital magazines bodes well for digital magazine advertisers, since this demographic has been historically hard to reach."Another good sign for digital magazines is that about 20% of tablet owners who read a magazine on their device also read back issues during their reading session.
Apps remain the dominant access point for digital magazines, with two-thirds of the tablet owners saying they got to the online magazine through an app (47% accessed magazine content through the magazine's website, and 37% read a digital reproduction (both content and ads). And yes, this adds to more than 100%, which indicates that some are reading more than one magazine on their device a month.
GfK MRI's also put together a short video on their digital magazine results.
Source - Tablets Attract Magazine Readers, Research Brief from the Center for Media Researh
The Changing Media Job Market - And How to Work It
From the Career Guide Tips website - some observations on how the search for a job has changed (and some personal thoughts):
Source - 6 Ways The Job Search Has Changed Post-Recession, Career Guide Tips
- Passive job searching is no longer an option. The days when that recruiter would offer you a job based on a glance at your resume or a short chat at a job fair is over. At least for starting jobs in media businesses. The one exemption is for later media jobs - an offer may well come once you have a history of producing good product, and someone notices.
- Fewer jobs means more competition. You might think that more competition in media markets might mean more jobs out there. But the new competition is succeeding by being leaner, and older media is responding to competition by cutting back on staffing. Add to that the fact that a lot of the folks who got downsized in traditional outlets are looking for jobs too, and it means you have a lot more competition for what jobs open up.
- Mistakes, even minor, are not tolerated. Proof that resume and cover letter! When a job search can generate hundreds of applicants, the folks going over them are looking for reasons to eliminate candidates from further consideration. Seeung mistakes is a quick and easy call.
This advice is critical for media jobs in particular, where even small errors can prove costly for employers - mistakes in production can render content unusable, and mistakes in journalism can result in lawsuits. If you're sloppy when you're looking for work, they'll worry that you'll be sloppy when you work. - Social media is the new recruiting tool. “Social media has made a huge impact for job seekers,” says Lavie Margolin, career coach and author of “Lion Cub Job Search: Practical Job Search Assistance for Practical Job Seekers.” “Employers are using social media to post job openings and look into candidate backgrounds via private Facebook pages. Job seekers have an opportunity to increase their visibility … via their LinkedIn page and possibly a blog that is industry-focused.”
For jobseekers in media or content related fields that last bit is critical - not necessarily that you need a fancy industry blog - but you need something that can serve as a showcase for what you've done, and illustrate your skills and what you can do. - Customization is critical. This is a bit of a corollary to #1. Sending out a bunch of standard resumes and cover letters isn't as helpful as doing a little bit of customization. Most job postings emphasize certain skills - and you should focus your letter and resume to emphasize your interest and skills in that area. You want to show potential employers that: 1) you actually read the job ad/posting and put some thought and effort into your application; 2) you have the skills that they're particularly looking for; and 3) you can adjust to changing circumstances.
- Networking is more important than ever. Being known can help to differentiate your application, and will at least assure a good look rather than a scan (unless it's in a negative context). A network can also help you learn about coming opportunities so that you can get your package in early. Daniel Newell, job development and marketing specialist for San Jose State University’s Career Center, advises job candidates to "join groups and attend socials through sites such as MeetUp and LinkedIn. Attending a casual social and being active in online and offline groups can open many doors to employment.”
In the media field, internships can also be a good way to start networking, as well as beginning to accumulate that portfolio of your work. Joining student chapters of relevant professional organizations can help, as can attending local events of the professional associations.

Source - 6 Ways The Job Search Has Changed Post-Recession, Career Guide Tips
Wednesday, February 8, 2012
Top Tech Predictions: A View from Broadcasting/Gaming
Matt Ployhar's posted his list of Top Technology Predictions for 2012 on the Broadcast Newsroom blog.
Source - Top Technology Predictions for 2012, BroadcastNewsroom.com
- Voice and Artificial Intelligence - from cars to smartphones to games to TVs - look for voice-controlled systems to move to more and more digital systems.
- Cloud Services - look for more and more content to be stored in, and delivered through, Clouds.
- Tablet Mania Wears Off - here I disagree - Ployhar doesn't see tablets as replacements for PC, and thus diffusion will slow. I agree that they aren't a full PC/laptop replacement, but a supplement - but that's why I see tablet adoption to continue to boom, as a basic tool for surfing, media consumption, and gaming.
- Smarter TVs - Ployhar hopes for an integrated TV/PC/Gaming platform with input devices built-in. I see smarter, in terms of integrating WiFi and Internet connectivity, but Ployhar's forgetting that all-in-one systems lock you into the system, and limit piecemeal replacement as technology advances. (Also, what about all that legacy hardware/software, and who gets to win the gaming platform battle?)
- China lifts it's ban on gaming consoles - who wouldn't want access to the world's largest market?
- E3 News - isn't it time for a new generation of consoles and gaming platforms?
- Google goes Big in 2012 - look for continued integration of Google's various platforms and services.
- Time for that Big Deal in Gaming - Will 2012 see one leader buying out another?
- The World's Still Flat - Globalization & Economic Climate remain mostly stable
Source - Top Technology Predictions for 2012, BroadcastNewsroom.com
Subscribe to:
Posts (Atom)