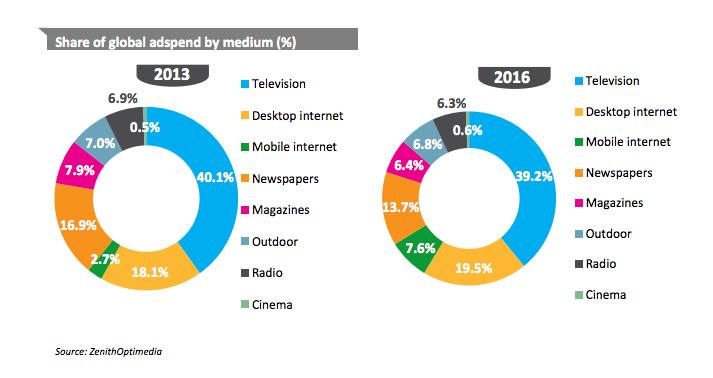
Recent estimates from ZenithOptimedia Group suggest that on a global level, at least, the advertising sector has returned to its pre-recession growth rates. The report now forecasts a 5.5% growth in advertising spending, reaching a total of $537 billion. The news isn't uniformly positive for all media, however.

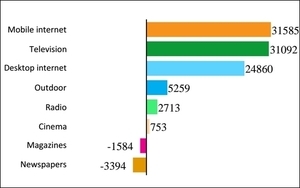
The overall growth is being driven largely by the rapid increase in online advertising. Internet advertising is forecast to continue to grow by around 16% annually for the next few years, with online display growing at 21% and social media ad expenditures growing by 29%. Online advertising can also be differentiated into desktop (static) and mobile sectors - and the report notes that the mobile sector is growing at 6 times the rate of desktop, hitting 50% annual growth through 2016. The ZO researchers said, "mobile will leapfrog radio, magazines, and outdoor to be the fourth-largest sector" by 2016
While the TV sector continues to draw the lion's share of global advertising, and is forecast to continue growing, the online sector's much faster expansion is closing the gap. The news is worst for print: both newspapers and magazines are losing ad revenues.
We predict internet advertising will increase its share of the ad
market from 20.7% in 2013 to 27.1% in 2016, while newspapers and
magazines will continue to shrink at an average of 1%‐2% a year,” the
report states. “Internet advertising overtook newspaper advertising
for the first time in 2013, and we forecast it to exceed the combined
total of newspaper and magazine advertising in 2015.”
The U.S. advertising market is forecast to continue its dominance of the global ad economy, but the report predicts that China (currently 3rd largest) will overtake Japan by 2016, while Indonesia and South Korea will overtake France and Canada among the ten largest ad markets.
Source:
Internet Ad Spend to Reach $121B In 2014, 23% Of $537B Total Ad Spend, Ad Tech Boosts Display, TechCrunch.com