Showing posts with label advertising. Show all posts

Monday, September 14, 2015

UK Newspaper News

It's been a while, but there's been a flock of articles recently about the present and future of the newspaper business in the UK that deserves a post.

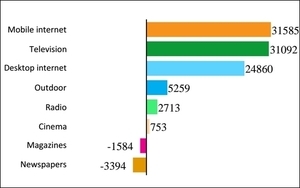
  • A ZenithOptimedia forecast predicts that mobile advertising expenditures will bypass newspaper advertising revenues in the UK this year.  The study shows a 38% growth in mobile, compared to a 4% decline in newspaper advertising.
  • The same report also shows mobile advertising surpassing newspapers on a global basis, based in part on the continuing decline in print advertising expenditures across most of the world. 
The worst part of the internet advertising boom for newspapers is the fact that not all digital sectors are reaping the benefits.  In particular, display advertising is lagging, and newspapers rely primarily on display advertising for their Internet and mobile sites as well as print editions. With the growth of ad-blocking on mobile devices, one analyst predicts that display ad revenues for mobile "are going to fall through the floor."

With predicted declines in revenues, many news outlets are looking for ways to trim already tight budgets further.  The National Union of Journalists  (UK's trade union for journalists) is warning that it's members are ready to strike if news outlets look to cut costs by shrinking newsrooms.

So the tough times for newspapers and other news outlets look to continue.

Sources - Mobile adspend in UK to overtake newspapers faster than expected, predicts report.  campaign

Friday, February 6, 2015

Mobile finally hitting TV, desktop usage

Research on smartphone penetration shows that there is a clear generational gap in smartphone penetration.  The gap shows clearly in a Nielsen report from last fall, and in recent Pew Research Center findings.

Penetration is one thing, and actual usage is another.  A number of recent reports show distinct generational differences in both frequency of use, and in the types of applications and uses.  Most of these reports, however, have yet to really establish that smartphone ownership and usage have had a serious impact on either TV viewing or Internet use on laptops or desktops.

A recent study by Millward Brown Digital (MBD) finds that 77% of Millennials (those aged 18-34) report using a smartphone on a daily basis compared to 60% of Gen Xers (aged 35-50).  While this fits in with previous research, the MBD survey also reports generational differences in other media habits. They report smaller, but still consistent, reports of daily TV viewing (77% for Millennials, 86% for Gen Xers, and 91% of Boomers), and daily use of laptops or desktops (58% for Millennials, 67% for Gen Xers, and 71% for Boomers).
The difference is enough that MBD's research director, Joline McGoldrick, indicated that online marketers are not only finding mobile as a growing segment of the advertising marketplace, but that marketers should take into account the emerging generational differences as well. Advertising placement on mobile is one of the fastest growing ad segments, with a 60% growth rate this year, and predictions that mobile will account for more than 20% of all ad revenues by 2018.

Source -  Millennials Spend More Time With Mobile, Impacts TV Time, Mobile Marketing Daily

Tuesday, February 3, 2015

Tidbits from Superbowl viewers

eMarketer released some recent poll stats on Superbowl viewers.

Almost half (46%) of smartphone and tablet owners reported they were likely to use a second screen while watching the Superbowl this year.  About a third said they'd likely be on social media, while one in five thought they'd be on sports cites or apps.  Grouping at just under 20% were the following uses: playing games, watching videos, checking news, and getting weather updates.

Another study looked at how people thought about Superbowl ads. It was no surprise that people overwhelmingly thought of them as primarily entertainment. About one in five thought the ads contributed to brand awareness.  Other than that, people didn't like the ads as advertising.  16.6% saw them as a waste of money that could better be used to keep product prices low; just under 10% thought they made the game too long; and about 7% saw them as unnecessary interruptions.  Only about 10% thought that the ads might encourage them to seek more information about products, or influence they buying habits.

Boom in online ad dollars - for some

Analyst Gordon Borrell puts the growth rate for online advertising dollars at 40% for 2014, and 42% for 2015.  Some firms could see online ad gains of 30% or more.  But for others, online dollars aren't going to be able to offset traditional advertising losses.

In particular, Borrell noted that newspaper print advertising is looking at continued advertising revenue declines of 10% annually.  Even when adding in the weak growth in online ad revenues for newspapers, total newspaper advertising revenues are predicted to fall 4.8 % in 2015.
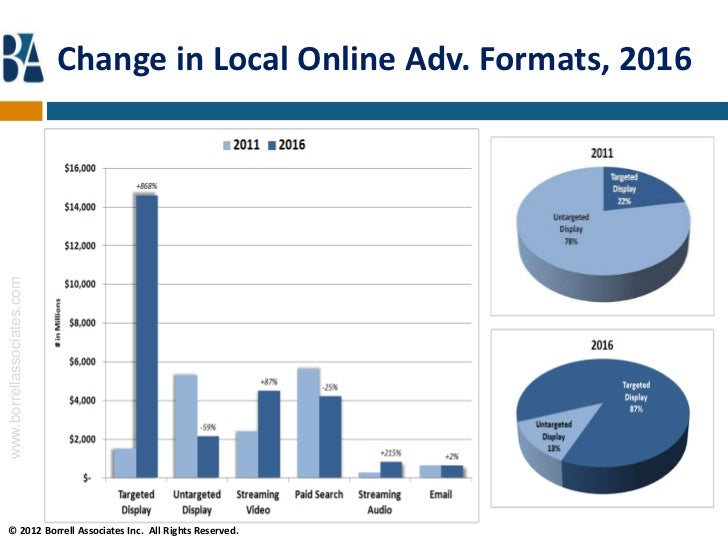
Furthermore, the report notes that even in markets where newspapers have strong digital news content, advertisers are shifting to more targeted sites for directed and targeted advertising efforts.

With targeted ads remaining the fastest growing sector, having an audience is not enough - you need to be able to demonstrate having the right targeted audience.  Newspapers have had trouble doing that for their online editions.  In fact, Borrell predicts that online "Internet pure play" sites will grab about three-quarters of local online advertising revenues - mostly at the expense of traditional media outlets.
The report suggests that traditional media strategies towards online advertising tend to fall into one of three basic approaches:
Traditional media companies stuck in the analog world, selling a little digital stuff because it’s easy, but not really believing there’s good money in it; traditional media companies that are more excited about the prospects but still reticent (or unable) to invest more in order to grow quickly; and traditional media companies that have seen the light and are determined to grow again, investing heavily in digital by hiring people or acquiring companies.
Borrell estimates that about half of traditional media outlets fall in the first group - which explains why they're losing out in local advertising markets - which is increasingly focused on highly targeted content and audiences.

Source: Analyst Gordon Borrell sees local digital ads soaring in 2015, but not for newspapers, Poynter.org


Tuesday, August 12, 2014

Case-Study- the Philadelphia Papers Long Fall

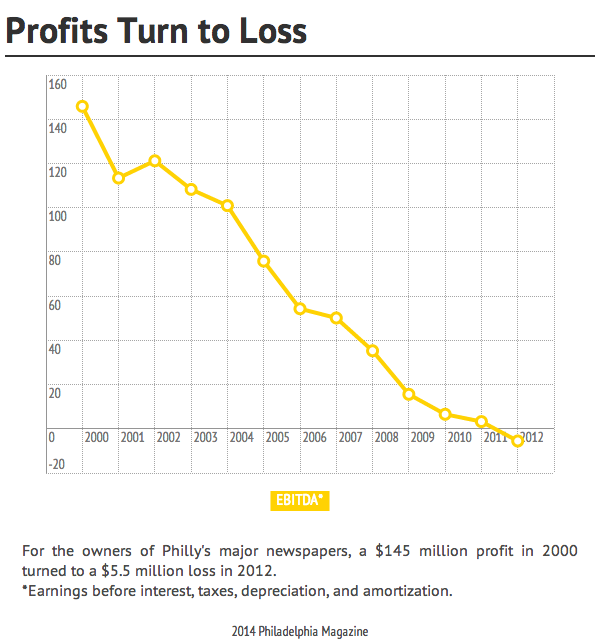
A good piece by Joel Mathis on the decline and fall of the Philadelphia Inquirer and Daily News.  Working from a financial report, he tracks the progress from being a reliable cash cow to bankruptcy in a little over a decade.

A large chunk of the problem was the same faced by most large urban dailies in the U.S. - a big drop-off in advertising revenues as one industry after another found better alternatives online.  It didn't help that this was followed by the recession - which hit all advertising revenues hard.

But when the industry started to recover after 2010, the loss of advertising continued to fall by double digits for the two Philly papers.  The fact that the papers changed ownership 4 times in 12, and the lack of consistent business strategies, didn't help either.

A look at the numbers suggests some other factors at work. 
    • Like most media facing revenue declines, the papers owners tried first to just cut costs.  But in Philly, it seems, the focus was on cutting staff (labor costs went from $243 million in 2000, to $135 million in 2012).  That's more than just trimming dead wood - it's the kind of cuts that will necessarily have an impact on quality.
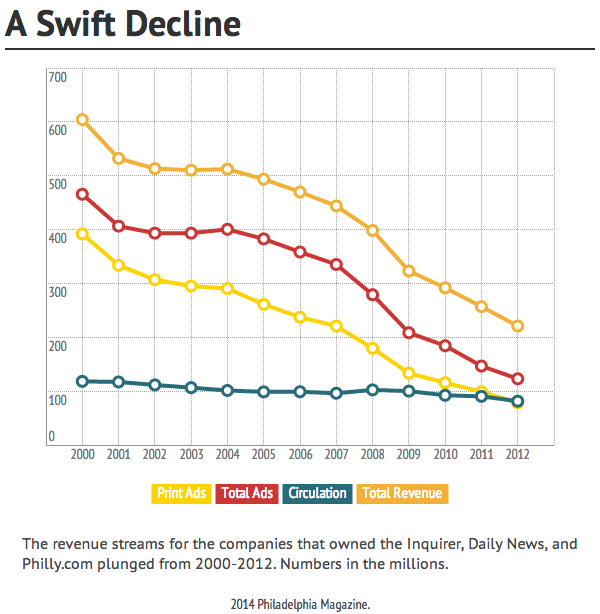
    • Those deep cuts can also be seen circulation losses.  Circulation fell from a high of 374,000 (2002) to 166,000 in the last audit - a loss of more than half their readership.  Such losses necessarily impact the value of advertising in the papers, accelerating ad revenue declines.
    • Circulation revenues also declined, but much more slowly than circulation losses.  This suggests that the papers tried cutting subscription discounts and/or hiking prices.  Increasing costs to readers while reducing the value of the product also feeds into the negative feedback loop for circulation.
Thus the various manager's plans created a near "perfect storm" of negative feedback.  Initial shifts in advertising categories prompted cost-cutting,  That led to a focus on cutting staffing, which impacted the value of the news product.  Declines in product value led to circulation losses, which were exacerbated by cost increases.  Massive circulation losses reduced the value of advertising, which gave advertisers even less of a reason to return to the papers as the recession ended.

There's one other interesting aspect to tease out.  Note that there's a large, but shrinking, difference between print ad revenues and total ad revenues.  That would include digital advertising, which hasn't grown much.  It also includes preprint advertising (i.e. inserts) - and for a while it seemed that the papers were doing well with that revenue category.  However, large circulation losses make inserts less valuable, and by 2012 it seems that the Philly papers had lost that advertising sector to competitors as well.

Sources -  "The Long Fall of the Philly Newspapers,"  PhillyMag.com
It turns out the 2000s were not a good decade for The Philadelphia Inquirer and Daily News,  Nieman Journalism Lab

Monday, April 21, 2014

US Newspapers Revenues Still Falling

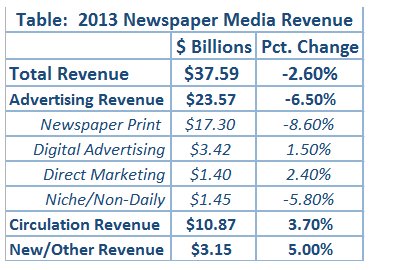
The Newspaper Association of America (NAA) has released its report on the state of newspapers in 2013.  The report trumpets "the best performance since 2006" - but that's because the overall revenue decline of -2.6% is the smallest annual percentage decline over that period.  Overall, the industry lost more than a billion dollars of revenue in 2013.  The fall in revenues was again led by a 8.6% drop in print advertising revenues.  According to the report, print advertising revenues account for less than half of total revenue.  Classified ad revenues continue to lead the decline (down 10.5%), but both national and retail advertising revenues fell by 8%.  Advertising revenues were also down (-5.8%) for weekly and niche publications.


Offsetting this was a modest 1.5% growth in digital advertising (overall, digital advertising is growing at a double-digit pace).  If there's good news in the report, it's the fact that the rapid adoption of paywalls for the online versions of print newspapers contributed to a modest gain in overall circulation revenues.  That, and the fact that the NAA managed to add $5.5 billion in additional revenues by including revenues from side ventures such as contract printing, weeklies, and a range of niche publications and services.  That really helped to slow the decline in the "total industry" numbers.  Still, revenues from all digital sources amounts to only 12% of total industry revenue, and newspapers' digital revenues continue to grow much more slowly than other forms of digital advertising.

Newspapers aren't out of the woods yet.

Sources -  Newspaper industry narrowed revenue loss in 2013 as paywall plans increased, Poynter
Business Model Evolving, Circulation Revenue Rising, NAA report\

(I made a number of edits for style and clarity after initial posting - BJB)

Monday, April 7, 2014

Recovery for World's Ad Economy

Recent estimates from ZenithOptimedia Group suggest that on a global level, at least, the advertising sector has returned to its pre-recession growth rates.  The report now forecasts a 5.5% growth in advertising spending, reaching a total of $537 billion. The news isn't uniformly positive for all media, however.
The overall growth is being driven largely by the rapid increase in online advertising.  Internet advertising is forecast to continue to grow by around 16% annually for the next few years, with online display growing at 21% and social media ad expenditures growing by 29%.   Online advertising can also be differentiated into desktop (static) and mobile sectors - and the report notes that the mobile sector is growing at 6 times the rate of desktop, hitting 50% annual growth through 2016.  The ZO researchers said, "mobile will leapfrog radio, magazines, and outdoor to be the fourth-largest sector" by 2016


While the TV sector continues to draw the lion's share of global advertising, and is forecast to continue growing, the online sector's much faster expansion is closing the gap.  The news is worst for print: both newspapers and magazines are losing ad revenues.
We predict internet  advertising will increase its share of the ad market from 20.7% in 2013 to 27.1% in 2016, while newspapers and magazines will continue to shrink at an average of 1%‐2% a year,” the report states. “Internet advertising overtook newspaper advertising for the first time in 2013, and we forecast it to exceed the combined total of newspaper and magazine advertising in 2015.”
The U.S. advertising market is forecast to continue its dominance of the global ad economy, but the report predicts that China (currently 3rd largest) will overtake Japan by 2016, while Indonesia and South Korea will overtake France and Canada among the ten largest ad markets.

Source:  Internet Ad Spend to Reach $121B In 2014, 23% Of $537B Total Ad Spend, Ad Tech Boosts Display,  TechCrunch.com

Tuesday, February 11, 2014

IAB: Metrics for Cross-Platform

Measuring passive audiences for one media platform is difficult enough - what about developing a metric that tries to measure interactive engagement and involvement across multiple platforms.  A number of major research firms are working on the problem, lead by Nielsen (looking to expand broadcast ratings to online) and comScore (looking to extend online metrics to broadcast and print).

Overseeing these efforts is the Interactive Advertising Bureau (IAB), an advertising and marketing industry group, which is setting guidelines and standards that the industry wants any cross-platform and interactive audience metrics to incorporate before they will be adopted by the industry.  The IAB has recently released a report setting out some basic definitions and outlining six broad goals and 30 core metrics that should be incorporated into proposals for industry-acceptable interactive advertising measures.

The goals recognize that it may be difficult, if not impossible, to build one single effective measure - still, core metrics need to be comparable to those used for other media, and have achievable benchmarks of objective performance.  The report also stresses that social media encompasses more than a single form of engagement.

Determining what you want to know is (or at least should be) one of the first steps in research, and particularly in the development of reasonable and valid quantitative measures.  Too many of the traditional metrics for traditional media were based on what could be easily measured rather than trying to measure the things that those using the metrics really wanted to know.  It's good that the industry is thinking about what it really wants to know about interactive advertising exposure and effectiveness, and isn't rushing to adopt something this time (despite Nielsen's several attempts to jump the gun and get the industry to support it's product).

Sources - IAB Redefines Ad Engagement, Clarifies Core Metrics Cross-Platform, Media Daily News
Defining and Measuring Digital Ad Engagement in a Cross-Platform World, IAB report

Thursday, December 5, 2013

"Unbundling" warnings

A study by Needham & Company media analyst Laura Martin cautions that a full unbundling of cable networks could result in a loss of up to 60% of TV advertising revenues, 124 cable channels would end broadcasting, and up to 1.4 million industry jobs could be lost.  The numbers sound extreme at first, but aren't out of the range of possibility - particularly with the rapid expansion of alternative video content delivery options.

As discussed in the earlier "Bundling vs. A la Carte" series of posts, (see here, here, and here), bundling cable networks works to expand potential audience reach, encourages sampling of channels and content, and permits occasional viewing.  A consequence of full unbundling for most cable nets would be a significant decline in audience, which will result in a big drop in advertising revenues that may or may not be countered by increased subscription/licensing payoffs.  For some, it may result in a death spiral of trying to hike subscription fees to recoup lost advertising, which will further shrink audiences, advertising revenues, as well as subscription revenues.

Currently, advertising counts for about 60% of TV/cable network revenues, and unbundling will undoubtably push the shift to greater reliance on licensing and subscriptions as a mechanism for funding content creation.  How sustainable that is for the 500+ TV programming networks remains uncertain.  Some high-demand high-value content will thrive, but many low-demand, limited and variable value content may not.  And certainly, I'd expect competition to shrink as many viewers are unlikely to want to pay separately for multiple channels in a genre.

As Martin notes,
“All content companies benefit from TV bundling, as well as from new digital platforms that are driving record free cash flows from content creation globally."
I hope that she's equally correct when she concludes that "(b)ecause consumers lose so much value through unbundling, we expect no policy change in the U.S.”  However, I'm a bit more skeptical that U.S. policy is driven more by economics and consumer interests than it is by outside special interests and politics - particularly those that provide campaign talking points..

Source -  Cable Unbundling Puts Majority of TV Ad Revs,  Media Daily News

Monday, September 30, 2013

Half of ad gains from mobile

The latest quarterly forecast of the U.S. advertising economy from ZenithOptimedia Group predicts that spending on advertising in the U.S. will show a 3.4% growth for 2013.  That's a slight downturn in the previous prediction of 3.5% growth.  The future looks a bit better - predictions of 4.5-4.5% growth in 2014-2015.  However, this remains significantly lower (20%) than what is predicted for global ad growth over the same period.  And on a global perspective, growth in advertising expenditures will continue to trail growth in GDP.

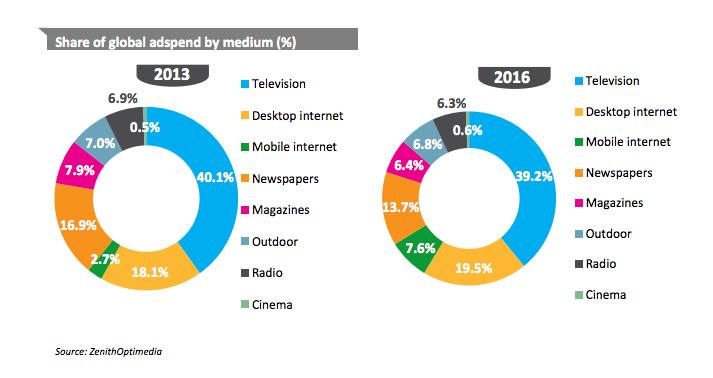
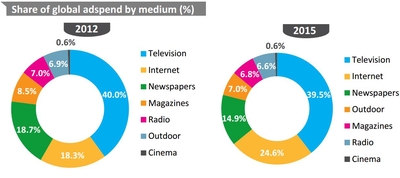
The problem for traditional media is that almost all of the growth is driven by digital advertising formats.  ZenithOptimedia forecasts that digital advertising will account for 21.8% of all US ad expenditures this year, and continue to grow to 28% of ad revenues in 2015.  And the fastest growing segment in digital is mobile.  (The figure shows global ad spending)
“Mobile advertising is still relatively small,” the Publicis media shop notes in its report, adding: “we expect it to total $6.2 billion this year, or 3.7% of total ad expenditure – but it is growing extremely rapidly.”
Another way of putting things is that the 2013 growth in mobile advertising accounts for about half of the total gains in US ad spending, and more than a third of global ad gains.  Total digital ad growth will account for two-thirds of total global growth in

In contrast, the study predicts that TV global ad share will peak in 2013 at about 40%, while newspaper's share will continue to fall, reaching 15% by 2015.  The shares for magazines, radio, and outdoor will also continue to decline.

Sources -  Upward Mobility: Hand-Held Web Accounts For Half of U.S. Ad Expansion, MediaPost Agency Daily
Executive summary: Advertising Expenditure Forecasts, September 2013,  ZenithOptima press release

Wednesday, August 14, 2013

Study Confirms: Growth of Online Classifieds Cost U.S. Newspapers $5 billion

A new academic study indicates that major US newspapers lost more than $5 billion of classified advertising to Craigslist.  The study looked at the impact of the entry of Craigslist into newspaper markets from 2000-2007, and the resulting changes in classified advertising revenues.
  The study found that those papers that relied heavily on classified advertising revenues experienced a 20% drop in classified advertising rates in response to online competition.  One consequence of the loss of classified advertising was the decline of the value of the paper to its consumers, which would impact both single copy sales and subscription levels. It also suggests that the advent of competition from online classifieds caused many newspapers to raise subscription rates to replace lost earnings, and that led to a further decline in circulation, that lead to declines in display ad rates (which are based on readership levels).  The study suggests that classified losses encouraged many newspapers to try to differentiate their content from its competitors, and less likely to make their content freely available online.
  In sum, the failure of newspapers to effectively compete with a more efficient and high-value competitor entering the market in this one sector triggered a downward spiral in both revenues and circulation.

What the study, and news report, don't bring up is that there was no reason that newspapers couldn't have entered the online classified market themselves, and captured a large share of that market.  In fact, several major newspapers had successful online classified trials in the late 1990s.  But most publishers felt that entering the online classified business might impact print circulation and sales - which it clearly did.  The problem is that rather than capturing that impact for their organization, they let somebody else grab it - and the resulting revenues and audience attention.

Sources -  Craigslist Costs Local Newspapers $5 Billion in Lost Ad Revs,  Media Daily News
"Response to Entry in Multi-Sided Markets: The Impact of Craigslist on Local Newspapers," research study by R. Seamans & F. Zhu

Monday, April 29, 2013

Downgrading 2013 Ad Outlook

Two of the top industry analysts have had to issue revised forecasts for 2013 as revenues, based on the year's slow start.  Publicis' ZenithOptimedia dropped its forecast for global ad revenue growth to 3.9% (down 5%), and US ad growth to 3.4% (down 3%).  Pivotal Research Group wasn't as optimistic, lowering its US ad growth rate to 1.2% this year.

The Zenith Optimedia report projected that global online ad revenues will continue its hot pace, growing 14% annually through 2015.
“Some broadcasters are starting to trade packages that include both online video and television spots,” (Publicis' Jonathan Barnard said), adding: “Advertisers are now recognizing the value of social media for brand building and purchase consideration purposes.”
Pivotal Research Group also forecast that digital will continue to grow faster than analog. Analyst Brian Wieser noted that growth is being driven by new brands seeking to differentiate themselves from competitors:
"(Those) advertisers can and will allocate significant shares of their budgets to digital advertising, as this has become the dominant ‘engagement’ medium for most advertisers, effectively replacing the role that print-based advertising served for so many years.”
Still, TV advertising dominates, although experiencing some shifts among subsectors -
“Cable will probably gain share of national TV budgets at a slightly faster pace in 2013 than occurred last year,” (Wieser) writes, adding: “On this basis, we forecast cable advertising growing by 5%, with broadcast networks down by 2% for all of 2013.”

Source -   Forecasters Downgrade 2013 Ad Outlook: Remain Bullish On Future, Especially For Digital, TV,  MediaDailyNews

Tuesday, April 23, 2013

Digital Now 25% of Ad Revenues

The advertising marketplace continues to evolve, according to a new study that examined actual expenditures from some of the world's largest advertising holding companies.   The new measures, from Standard Media Index, is claimed to be the most accurate view of actual media spending.
“Television spend continues to slow -- at a rate of -2% during the first quarter of 2013 -- driven by March’s year-over-year decline of 5%,”explains SMI analyst Kristina Luland.
TV, despite the weak performance, remains the largest target of ad dollars, accounting for 60.3% of all ad expenditures.  Within that sector, ad revenues fell 6.2% for broadcast networks, while ad revenues for cable networks rose 1%, making cable networks the largest contributor to total TV revenues at 25.6%.
  In contrast, ad expenditures for digital media were up 15% over the last year and now accounts for 24.6% of the advertising marketplace.  In fact, every segment of the digital ad market saw double-digit growth in ad revenues, led by mobile (up 92%) and exchange-based ad buys (up 46%).

Source -  Digital Now 25 Cents Of Every Ad Dollar: Display, Search Still DominateOnlineMediaDaily

Tuesday, April 16, 2013

The Coming TV Revolution: Can Over-the-Air Free Broadcasting survive?

A number of trends are coming to a head - and may quickly and radically transform the TV (and other video media) landscape

  Broadcast TV has remained the primary force and driver throughout myriad technological advances - coax birthing cable; VCRs facilitating time-shifting and opening new choices for viewing; satellites transforming signal distribution and leading to an explosion of networks; computer gaming providing an alternative use for TV sets; digital networks & the Web opening the market (especially at broadband speeds); mobile and the "TV Everywhere" potential; social media prompting new levels of engagement; among others.  All these have opened the market to competition, and the explosion of choice has led to shrinking audiences and falling revenues - even with TV ad spot prices increasing.
  Still, the big networks remained the top draws in programming, grabbed the lion's share of national ad revenues, and remained, through its public broadcast outlets, more or less universally accessible.

  That's starting to change.  The audience share for the Big 4 broadcast networks has been falling for almost a half century.  This winter saw one of the Big 4 networks' entire schedule outperformed by Spanish-language broadcaster Univision in the key 18-49 demographic.  In the Winter sweeps, a cable show (A&E's Walking Dead) outperformed every broadcast network regular scripted series program.  If you exclude big sporting events and reality programs, most of the Big 4's current prime time schedule was outperformed by cable TV reality programs (Duck Dynasty, Swamp People) and WWE Pro Wrestling.  That's not a position of strength in the market.

  And then there's the impacts of DVRs and other viewing alternatives. This last ratings year is seeing most scripted programs experiencing significant time-shifting - from 15% to as high as 50% of a shows audience coming from time-shifting - whether through DVR replay, access through Video on Demand offerings, or streamed from network online sites. The shift isn't stopping with broadcasting either; recent studies show that more people are watching Nickelodeon's programming via NetFlix streaming than are watching the network itself.  TV viewing habits seem to be changing.
  Alternative viewing creates problems for an industry dependent on advertising - particularly when a sizable portion of value comes from being able to target times and specific audiences.  One problem is counting those who delay viewing.  That problem's been around since VCRs, although it's really grown significant only recently.  Nielsen's tried to keep pace by developing multiple ratings measures - the original live viewing ratings while introducing new ratings measures that also include delayed viewing within various time-frames.  However, the industry hasn't settled on how to best capture online streamed viewing, so much of that remains unmeasured.  Even with better measures of delayed viewing, much of it occurs through devices that allow users to fast forward through ads or skip them entirely; and VOD and streaming services don't necessarily include the same ads as aired in the original broadcast.  As such, the expanded ratings may capture the additional program viewing, but aren't really helpful in measuring advertising's reach, or adding value to the live ad spots.
  Then there's cord-cutting and the zero-TV homes.  Those terms address different impacts of the rise of online video streaming.  "Cord-cutting" refers to the growing phenomenon of people dropping some or all of their multichannel feeds and relying on a combination of over-the-air broadcasting and online streaming to provide their TV content.  Research suggests around 1 in 10 multichannel subscribers have dropped some or all of their multichannel service (the vast majority dropped pay or more costly advanced tiers while keeping basic service), with another 5-10% considering the move.  While cord-cutting may become a significant problem for those services that are dropped, you would think that it would help broadcasters as the primary source of live TV.  "Zero-TV" homes take things a step further; the term doesn't refer to those without a TV set and who never watch - rather it refers to those who get their TV and video content entirely from non-traditional TV channels.  Primarily from online streaming, online downloads, and recorded home videos (movies and TV programs).  While initially only a small portion of the U.S. TV audience, Nielsen recently announced that it will start including those households in their sampling, and will eventually integrate their viewing into its TV ratings system.  Initial studies suggest as many as 5 million USTV homes fall into the "Zero-TV" category.
  Declining audiences are also evident in drop-offs in advertising revenues.  TV's aggregate share (broadcast and cable) of national ad dollars has fallen below those for online advertising.  Advertising revenues for cable networks surpassed those for broadcast networks a couple of years ago.  At best, TV ad revenues have diminished long term potential.  TV ad revenues, like all advertising media, took a hit in the recent recession, and growth rates have slowed behind other advertising outlets, resulting in a shrinking share of volatile advertising dollars.  TV businesses, like newspapers and cable firms before them, are seeking new revenue streams.
  One potential new revenue source is licensing.  The jump in retransmission fees in the latest round of negotiations, the success of cable and DBS in getting consumers to pay for TV, and the more recent success of online streaming services like Netflix, Hulu, and Amazon Prime, have amply demonstrated the potential value of licensing as a revenue source.  TV and video firms are starting to look in that direction for revenues to replace advertising losses.  In fact, broadcast networks are already scrambling to grab a share of retransmission fees from local broadcasters, creating problems for many local stations.

All of this helps set the stage for the major networks knee-jerk reaction to two innovations fostering the "TV Everywhere" concept: Dish's Hopper with Slingbox, and Aereo.

  Dish's Hopper started as a DVR-type service with two particular twists: it would automatically record every network prime-time program, instead of only those selected by the viewer; and it included technology that allowed viewers to skip all commercials during replay.  To handle the volume of the entire prime-time schedule, much of the program storage would be in Dish's cloud rather than in the subscriber's set-top box.  These factors were enough to get most of the major broadcast firms to challenge Dish in court, trying to prevent its implementation.  Then came another innovation when Dish announced the integration of Slingbox technology, which allows viewers to stream content received at home to Internet-connected devices anywhere.
  With the first announcement of the Hopper service, major networks sought to challenge the legality of the service and technology, largely on copyright and intellectual property grounds, and seeking an injunction that would prevent Dish from implementing and offering the service.  In particular, CBS, and its CEO Les Moonves, not only reacted negatively, but badly.  After the Dish Hopper with Slingbox was voted "Best of Show" at the last CES (Consumer Electronics Show) by C/Net (owned by CBS) editors, Moonves' office ordered them to remove the device from consideration, and to not report any more news or information about the technology or service.  (This was after promising C/Net complete editorial autonomy).  Moonves also threatened to pull CBS off the Dish DBS system if they didn't stop promoting the commercial skip function.  (Revealing also his ignorance of DBS operations and rules: first, Dish doesn't carry the network, they carry local broadcast stations which are CBS affiliates and FCC rules prohibit network interference with local station operations; second, unlike cable, local station carriage rules state that if a satellite service carries any local station, it must carry all local stations in that market.)

  Aereo's technology allows users to access local broadcast signals through the Internet.  It's primarily a place-shifting technology (like Slingbox), rather than a time-shifting technology (DVR, Hopper).  As such, it's impact is to expand the potential audience for local broadcasters, so it's less clear why broadcast networks and station groups would be in opposition to a technology that would only expand their reach and their audiences for advertisers.  Still, a number have joined forces to file a lawsuit aimed at prohibiting the service, again mostly on copyright grounds. (I've speculated it's just because they want to grab a share of Aereo's subscription fees).  A number of the broadcast networks, Fox publicly, have threatened to pull their programming from over-the-air distribution if Aereo and similar "TV Everywhere" technologies are allowed to continue.

  The central question in the two lawsuits is whether the services fall under the guidelines established in the 1984 Betamax case.  In that landmark case, the Court ruled that technologies that technically could be used for copyright violations were legal if they also had substantial non-infringing uses (primarily under "fair use" exemptions).  Among the specific qualifying "fair" uses were time-shifting and/or place-shifting legally acquired content for private use - key features of the challenged services.  Initial rulings in the two cases with respect to seeking preliminary injunctions to ban the services while the case was in progress went against the network/broadcaster groups.  Both judges found that the services had viable "fair use" arguments that would need to be addressed more fully in court, and thus denied the petition for a preliminary injunction.  A Fox spokesman went a bit overboard reacting to one of the rulings:
"the court has ruled that it is OK to steal copyrighted material and retransmit it without compensation."

  This has resulted in an interesting dynamic - Hopper's commercial skipping currently only applies to the the broadcast networks' prime time recordings, and Aereo only redistributes over-the-air broadcast signals.  In other words, those technologies pose issues only for broadcasters. Thus, the renewed interest in "going cable."  It's not a totally new idea for the networks - as early as the 1990s networks looked at cable network licensing fees and thought about grabbing a share of that revenue stream.
  However, it would only work if they abandoned over-the-air broadcasting fully, which would have serious impacts on their own advertising revenues (resulting from the reduced reach and audiences) and the profits from their owned-and-operated local stations (which typically cover losses from network operations). Multichannel coverage has expanded to around 90%, which can qualify as "national" coverage, but there's also the question of whether multichannel operators, and viewers, would be interested in paying for programming that has been proudly touted as free throughout its history (particularly at the price the broadcast networks think they're worth (which is in the range of $10-25 dollars per subscriber per month). 
  Frankly, if they can't draw significant audiences for "free" content, it's not clear why viewers would be willing to pay heavily for it.  Even if the broadcast networks settle for an additional $50 per month per subscriber (for the Big 4 broadcast networks), that would be a huge jump in cost for multichannel subscribers.  It seems likely that a lot more people will drop those channels or services (if possible) with such a price hike.  Multichannel distributors are already moving sports channels into separate tiers (with much smaller reach) in response to concerns over $5-10 monthly subscription increases driven by skyrocketing sports licensing fees.  These jumps are also fueling talk about implementing "a la carte" pricing models (where subscribers pay only for pre-selected channels).  Big price increases would clearly drive demand down (shrinking potential audience), and economic research on "a la carte" also suggests "a la carte" pricing results in huge declines in demand, and thus audiences. And further significant drops in audience would clearly result in sizable drops in advertising value and revenues.
  The move would also significantly impact local broadcasting, removing a large amount of a station's most popular programming, which would also have to be replaced.  Studies suggest that losing a network affiliation can cost a broadcast station as much as 75% of its value, and could result in half to two-thirds of local TV broadcasters running significant losses and most likely ceasing operations.  Including those owned and operated by the networks parent companies.  Are those companies willing to write off some of their most profitable assets in the hope that they can pull big bucks as a cable network? 
  Then consider the PR nightmare of viewers facing price jumps of $50 or higher a month, just to access what they've always been told is "free TV".  And then consider how Congress and the FCC would react to something that would significantly damage (and possibly kill off) free over-the-air broadcasting). 
  The reaction really seems overblown, particularly when considering that the actual economic impact of these new technologies and services is likely to be minimal.  Sure, commercial-skipping may reduces the value of ad spots, but those aren't being counted now anyway.  In addition, keeping programming accessible longer, and available over more devices in more places actually increases the potential for viewing. The net impact of these technologies on the financial bottom line is likely to be minimal.

Source -  Tech upstarts threaten TV broadcast modelIT Business Net

Edits - had to clean up some language and missing phrases. Added a la carte issue

Monday, April 15, 2013

Ad "Upfronts" for Online News

TV in the U.S. has had "upfronts" - where networks host previews of upcoming seasons for big advertisers, agencies, and news media, and start advance selling of premium ad spots - for decades.
The Interactive Advertising Bureau now hosts Digital Content Newfronts - an upfront event showcasing online content and advertising opportunities.
  The initial reaction was skeptical - after all there's no scarcity in the display ads market.  However, the last year or so has seen the growth of high-quality video ads, sponsorship opportunities for high-profile sites and content.  More importantly, audience research is showing that online video ads and exclusive sponsorships can have significant impacts - in fact, they may just be more valuable than many traditional media opportunities.  Add to that the fact that the TV and cable networks keep hiking rates even as viewing falls, and we're starting to see advertisers thinking about other outlets.
"The only way to reverse that trend is think about video in a different way and move dollars across screens," said Universal McCann Chief Media Officer David Cohen. "Is this the year we see a billion moving into the (online ad) market? Could be."
With premium online opportunities limited, the Newfronts are getting interest and involvement from top content producers and advertisers and agencies - and opening the events to a range of online advertising formats.  The events are also producing deals - deals totally in the hundreds of millions (US dollars) were reportedly made at this year's Newfronts - a sizable share of an online advertising market expected to exceed $1 billion.
YouTube sales chief Suzie Reider said it's important to present an organized, united front to the buying community. "This is about "We've grown up,'" she said. "We're not a ragtag group of digital sites."

Source -  Digital Newfronts Poised to Rake in $1 Billion in Ad DealsAdvertising Age

Monday, March 25, 2013

Ad spending shifting Online

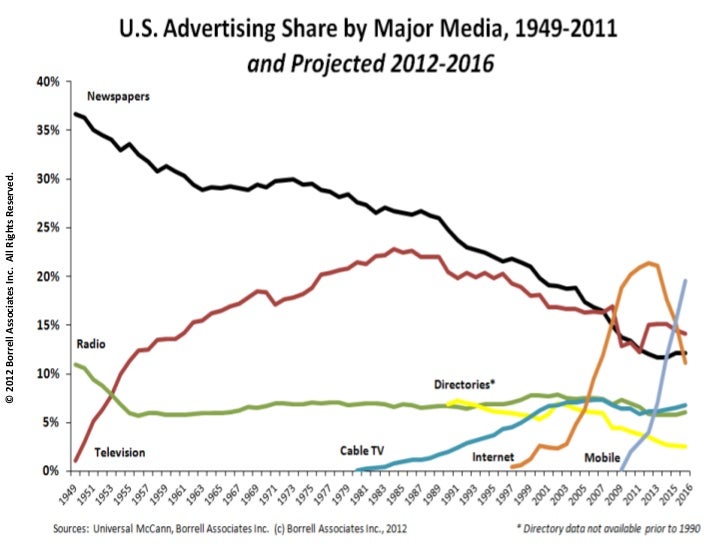
2013 is looking to be a major transitional year - one where a lot of big changes are occurring in the media landscape.  Here's an interesting table from Borrell Associates on the change from 2012 ad levels and those forecast for 2013 (in the U.S.).
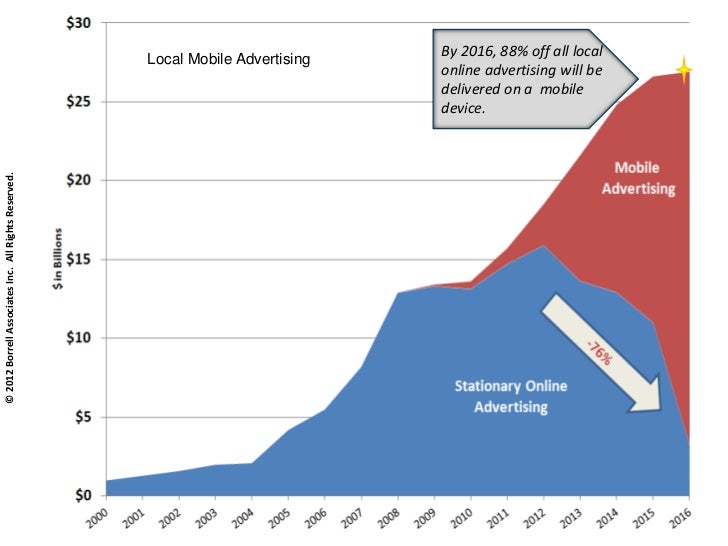
The biggest change is the boom in online advertising - up 17% in the national ad market, and up 30% in the local ad market.  One factor aiding that growth is the success of Google Adwords service, which has grabbed 44% of the global online advertising market.
The table above looks at the share of advertising dollars for various media in the U.S.  The most notable trend is ref;ected in the black line of newspapers, who have seen their domination of advertising revenues fall precipitously, eventually surpassed by the television market.  If you combine TV and cable, they indicate that video advertising now dominates - while radio's share has been fairly stable over time.  The table shows the rapid increase in internet advertising - the downturn in their golden line is for forecast revenues, after pulling out the new media darling for advertisers - mobile. 

If you combine internet, mobile and social advertising, you see that online advertising is set to compete for top share, if not become the dominant media for advertising.  The opportunities that mobile and social media offer for targeting is just starting to be explored by advertisers.  The next few years should see a lot more investment in highly targeted, highly contextual, mobile and social advertising.
 

Source -  Local Advertising & Online Forecasts for U.S. to 2016,  Borrell Associates presentation

Friday, March 22, 2013

Scary Graphic for Newspapers

From The Atlantic:

Since 2003, print advertising revenues for newspapers has fallen from $45 billion to $19 billion, while online digital advertising has grown from $1.2 billion to $3.3 billion.  In other words, over the last ten years, the average annual decrease in print advertising revenues for newspapers is larger than the total increase over that decade in online advertising revenues.

Source -  This Is the Scariest Statistic About the Newspaper Business TodayThe Atlantic