Wednesday, February 27, 2013

Goin' Mobile: News from the Mobile World Congress

There's some interesting reports coming out in connection with this week's Mobile World Congress (WMC) in Barcelona.
Cisco's been downgrading earlier estimates of the rate of growth of mobile data traffic (from over 70% annual rate of growth, to 66% - details in this post).  Cisco's report mentioned a number of factors, from the spread of tiered pricing in mobile data plans, to declines in sales of mobile-connected laptops.  But underlying these is an interceding behavioral change - users and operators are managing data traffic better, shifting high-usage traffic to WiFi and off-loading it to wired networks (about a third of mobile data traffic was shifted and offloaded to wired nets in 2012).  This is helping to flatten demand and peak load demands.  Between business, home, and free hotspots, WiFi usage is changing the mobile data value chain - offering users a low-cost but somewhat location-limited alternative for low-value and/or high-content apps and data streams.  What's a bit amazing is how quickly and widely users have recognized the value differential and adapted to tiered data plans - 98% of iPhone users also use WiFi, as do 89% of Android smartphone users. Consumer usage patterns are beginning to shift, with mobile data usage increasingly focused on high-value, high-immediacy, and highly-localized apps and uses.
  The shift is actually good news for mobile operators.  The ability to offload via WiFi as a low-cost alternative is helping to improve data traffic flows and reduce peak demand levels; this will slow demand for in-network capacity upgrades.  The low-cost WiFi option, in the meantime, provides a place where users can explore new apps and uses, allowing them to establish values for new apps, as well as exploit relatively low-utility markets like entertainment content, gaming, and social media.  Now, mobile operators can focus on identifying, marketing, and siphoning off the high-value apps.  Doing so will help operators better monetize their mobile bandwidth.
  And doing so may well become critical. It's becoming more and more apparent that data is on its way to becoming the dominant revenue stream for mobile operators.  The problem is particularly acute in Europe.  There, major mobile operators are seeing their voice and SMS revenues falter.  Growing competition within mobile, as well as low-cost alternatives (IP telephony, online conferencing, social media) in an increasingly connected world, are shrinking margins.  While average revenues per user has risen 25% over the last five years in the U.S., it's actually fallen by 15% in Europe.
  Swisscom's CEO, for example, has publicly predicted that their voice and SMS revenues will just about disappear within three years.  The European mobile market is seriously overcrowded (100 operators, compared to 6 in the U.S.), and heavily regulated.  That, and the poor economic conditions have resulted in four years of declining revenues have hit margins, and company valuations, hard.  European telco stocks are trading at half the earnings multiple of U.S. mobile operators.  And this has hurt their ability to raise the $800 billion the GSMA trade group has estimated is needed to upgrade to 4G by 2016.
For Bernstein analyst Robin Bienenstock the problem is European telcos have no confidence that investing in networks to offer superior service than rivals will pay off.
"So they don't invest, they just cut costs and tweak pricing, locking themselves in a vicious cycle of selling an increasingly commoditized service," she said.
"If you are an American consumer, especially in a big city, there has been a tangible improvement in what you're being offered on mobile speeds, whereas for Europeans, there has been a deterioration in quality."
  Successfully negotiating the shift to data, and building out 4G's mobile broadband services, looks to be critical for mobile markets.  Where data-focused and 4G systems are well on the way (U.S., several Asia-Pacific markets), operators are establishing that the demand (and monetizable values) for data-based mobile apps is there, and showing the potential for rapid growth.  With their early success, and the dismal forecast for older cellular services (voice, SMS) in Europe, it's expected that European mobile operators will use the WMC to push EU regulators to get out of the way and give them a viable shot to grow the mobile broadband market.  Good luck with that.

Sources -  Improved traffic distribution indicates that operators are managing assets more effectively, Telecoms.com
Divide between European and US telcos widens, TelecomEngine
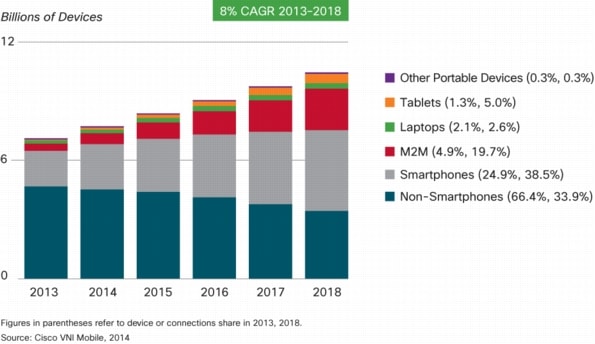
Cisco Visual Networking Index: Global Mobile Data Traffic Update, 2012-2017, Cisco white paper
Understanding today's smartphone user: Demystifying data usage trends on cellular and Wi-Fi networks, Informa white paper.

Tuesday, February 26, 2013

Transparency and the Value of the White House Press Corps.

Obama: “This is the most transparent administration in history, and I can document that is the case.”

Obama: “And with that, what I want to do is clear out the press so we can take some questions.”

Poynter:  It’s easy to claim the title of most transparent administration in history, if you define “transparency” as “releasing 100 percent of the things you want to release.”


  With all this transparency, one might excuse David Weigel's column in Slate questioning the need for a White House Press Corps.  He starts with the pool report from earlier this month, detailing negotiations to have pool coverage of an event.
“All we're asking for is a brief exception, quick access, a quick photo-op on the 18th green,” Henry told Politico’s Dylan Byers. “It's not about golf—it's about transparency and access in a broader sense.”
And yes, they're talking about the President's golf date with Tiger Woods.

It's not just lack of access (Obama has held 35 press conferences and taken questions after 107 events - his predecessor held more than 100 press conferences and took questions after 355 events in his first term), but the lack of tough questions from the White House Press corps in the daily briefings. 
Weigel looked at the questions the White House Press Corps asked after the State of the Union Address, and found, basically, three general queries in the weeks since.
  1. "How will you pass this?"
  2. "How do you respond to this?"
  3. "Remember when you said this?
Tough questions, all.

And covering a President full-time is expensive.  Reporters in the pool for the golf outing with Tiger paid around $3500 for the privilege of reporting... nothing. (The only interaction with the President was off-the-record).  Costs can be as high as $33,000 per person for a three day domestic trip (to California), and the President's three-nation trip to Asia last fall ran an estimated $35,000 a head.
  It's gotten to the point where major news organizations are wondering if traveling with the President, or even having a credentialed White House Correspondent, is worth it.
“It costs some of our [news] organizations millions of dollars a year to cover the president,” said Ed Henry, head of the (White House Correspondents Association).... “Would we like to find ways to make it more economical and efficient? Yes, we would.”
“All of these trips are important because you don’t know what hasn’t happened yet,” said Cameron Barr, The Post’s national editor. News organizations “have to balance the cost of not being with the president and missing something important.”
The Wall Street Journal's Gerald Seib commented - “when the president is doing the president’s business, our inclination is to be there... You do wonder at times, is this worth it?”

  Is it worth it?  Probably not, if you're not bothering to get real news, or even something that's not already in the pool reports or wire service feeds. The real question is will the press make it worthwhile and valuable by actually doing real journalism?


Sources -  Who Needs the White House Press Corps?Slate
Traveling reporters get bill, but little news, when Obama's on the RoadThe Washington Post
Is the Obama administration really the 'most transparent' ever?Poynter

Radio and Local Online Ads

A new study from Borrell is predicting that radio's "turning the corner" in digital ad sales, with a forecast of $420 million in total local online ad revenues for 2013.  In a survey of 1075 stations, 17% indicated that the expected their local online revenues to grow more than 30% this year.
  The gains, however, are not evenly distributed.  Over half of the radio stations and clusters reported online revenues of less than $250,000 in 2012, while the upper 3.4% reported online ad revenues of at least $3 million.  And while hopeful, the growth in online ads revenues in radio (14%) fall well below the overall growth rate for local online advertising (30.8%).  And local online remains a minor revenue source for radio, reaching 2.5% of radio ad revenues in 2013.

Source -  Radio's Local Online Ad Revs Rocket 14%MediaDailyNews

Battle for Sports Rights Hits Home (Hard)

  While ESPN remains the 800-pound gorilla in sports networks, it's been challenged by major pushes over the last year by NBC, CBS, Fox, and Turner to build up their branded sports networks.  Last week, News Corp. joined the fray, announcing plans to build a major national sports network.  (Not to mention 50+ regional sports channels all looking for content.) The bidding wars have pushed sports rights fees to even more astronomical levels, and someone ends up paying.
  The other primary factor pushing the bidding wars is the fact that sports is one of the few remaining TV programming sources reliably delivering live audiences.
Simply put, sports ratings not only remain robust in the face of declining tune-in for almost everything else, but they are one of the few commodities TV viewers insist on watching live, which removes (or seriously diminishes) the impact of delayed DVR viewing.
As a result, sports is widely seen as the one thing you've got to have - as a network and as a multichannel provider.  Combine absolute demand with growing competition and the price keeps rising.
  The result? The NFL will get $2 billion a year out of its multi-network deals (a figure up 70% from the last round of deals). The Los Angeles Dodgers signed a $7 billion deal with Fox, while the Lakers got $2 billion in its latest deal. ESPN will be paying $470 million a year to air the new college football playoff games, on top of the billions it's paying for the top Bowl games. Major League Baseball's latest deal will generate $12.4 billion from three sports networks. NBC paid $1.8 billion for the London Olympics, and $4.38 billion for the US rights for the next four biennial events.  The rising cost of sports broadcasting rights is felt internationally, particularly for big events.  Telco BT (British Telecom) is making headlines with its recent deals to air matches from top soccer leagues across Europe and its purchase of ESPN's UK and Ireland channels (BT's building a telco cable service, supplemented by broadband net access, in competition with satellite service BSkyB).

  The networks push the costs down to the multichannel video providers (cable, DBS, telco cable), and they're pushing the cost through to their subscribers.  Until recently, these have been buried in the basic subscription fees along with the other programming costs.  The cost of sports channels can reach 50% of all programming costs to multichannel providers. However, recently, major providers like Cablevision, Time Warner cable, DirectTV, and Verizon FiOs are adding monthly surcharges for sports.

  Of course, skyrocketing sports rights aren't the only thing driving multichannel subscription prices higher.  A SNL Kagan study identified two other factors - the fact that broadcast stations are now getting real money for retransmission fees, and the explosion of channels now carried by digital providers.
  The surcharges and rising fees are driving another round of calls for mandating "a la carte" pricing from multichannels.  Which, while it sounds good, is actually very bad economics for subscribers as well as networks and multichannel providers (discussed briefly in this post).


Sources -  Cablevision to Inplement $2.98 Sports Surcharge, Multichannel
Rising fees for sports rights 'indispensable' and 'unsustainable', Sports Business News
BT ups ante against BSkyB with ESPN deal, The Telegraph
Kagan study outlines program cost drivers for MVPDsRBR.com
Changing the game: Outlook for the global sports market to 2015, Price Waterhouse Cooper white paper

Monday, February 25, 2013

US TV Networks Falter in Feb Sweeps

After a slow start this fall, the audience numbers for America's Top Broadcast Networks just keeps getting worse. Numbers from the February sweeps are at historic lows.
  The Biggest Loser - NBC, which moved from #1 in the Fall Sweeps, to fifth place for the February sweeps - falling well behind Univision with a 4 share.  In fact, Univision outdrew NBC almost every night of sweeps among the key 19-49 demographic.  NBC also earned the lowest ratings ever for an in-season scripted series premiers with Do No Harm, a 0.9 rating and 3 share.  And then lost a third of that audience with the second episode (0.7 rating/ 2 share), before being quickly cancelled.  Season 2 of Smash debuted with audiences 79% below its Season 1 debut, and 39% below the Season 1 finale - a rating of 1.1 / 3 share.  And then dropped another 25% to a series low of 0.9/2 last week.  Only two NBC series were able to average a 2+ ratings this sweeps period among the 18-49 demographic: The Biggest Loser and The Office.
  And its not that the other networks were doing that well, either.  For the last week of sweeps, audiences for the Big Four networks were down 23% from the same period last year. In that week, only one network was able to average a 2.0 rating - Fox managed to get a 2.1 rating, for a 6 share.
CBS, which leads the sweeps period in every demographic, has seen series-low openers for reality shows “Survivor” and “The Amazing Race,” and yesterday it yanked the new unscripted series “The Job” after just two weeks.
ABC’s “Zero Hour” and NBC’s “Do No Harm” both premiered to the networks’ lowest-ever in-season drama debut ratings. Several of their veteran shows, including “Smash” and “Revenge,” have hit series lows this month.
And Fox’s one-time juggernaut “American Idol” has dipped to ratings not seen since season one. Meanwhile, its plan to relocate “Touch” to Fridays has been a huge bust, with the drama drawing just a 0.7 last week.
So what's up?  For one thing, the quality of cable network original programming - AMC's The Walking Dead outperformed every Big Four network show in the 18-49 demographic. Another culprit is the DVR, whose use by audiences continues to climb.  And then there's the streaming options of Netflix and the like, ensuring viewers that they don't have to settle for the least bad program when they sit down to watch a little TV.

For a guy who grew up when the Big Three would regularly pull prime time shares in the 30s - and ratings in the 20s, rejoicing over a 6 share is a glaring reminder that the TV market has changed, and of how far the once-mighty have fallen.
On the other hand, though, it's also a reminder of how much better things are for TV viewers. 

Sources - Behind the great broadcast ratings dipMedialife Magazine
NBC To Finish 5th In Sweeps For First Time; Network Falls Behind UnivsionDeadline Hollywood

Neilsen Redefines "TV"

If you've been paying attention to the evolving media landscape, changing audience behaviors, and debates over measuring viewing (or listening, reading, etc.), you knew this was coming.
  According to press reports, Nielsen's been telling it's clients that it's changing its definition of TV.  Since it's beginning, the Nielsen ratings universe has been based on TVHH - households with a working TV set, and measured viewing as occurring on TV sets.  Certainly definitions that made sense when the only way to watch TV programming (and ads) was through a television set tuned to a broadcast.  The definitions endured through the rise of cable (and DBS), VCRs, DVDs, etc.  While greatly expanding viewing options, you still needed the TV set as the display. 
  The digital revolution started changing that - you could connect TV tuners to computers and watch on the computer's display; TV content went online, and broadband diffusion made high quality streaming viable; DVRs fulfilled the VCR's promise of time-shifting, and mobile looks to fulfill the promise of place-shifting.  Time-shifting increased to the point where Nielsen and the networks had to find a way to count that audience, and continued growth of time-shifting ignited the current debates over what time period gets added in to the live viewing.  Still, however, the feeling was that the key component of TV was the larger TV screen - and that remained the foundational definition.
  For now, the TV set remains the foundation, but Nielsen will start looking at internet-connected TVs and viewing via internet streaming.  Nielsen's basic shift is that they will start including internet-only TV households in its sample, and start tracking viewing via streaming.  At this point, the proportion of (zero TV profile) households - those that don't watch TV over traditional (terrestrial broadcast, multichannel bundlers) channels - is small, but growing.  Nielsen estimates that when the new sample ratings kick in this coming fall (2013), the impact will initially be small (around half a ratings point), but as the "zero TV" segment grows, Nielsen wanted to be in a position to capture shifting behaviors.
   For advertisers concerned that these new delivery systems aren't carrying the original broadcast commercials - inflating the numbers reached and their costs - Nielsen indicated that, for now, the extra viewing will be captured separately, and specifically won't be included in the C3 ratings that form the basic currency in network/advertising rate-setting.  (C3 counts live viewing plus time-shifted viewing within three days).

The move should be welcomed as a step in coming to grips with the shifting media-audience ecosystem.  And help foster recognition of shifting media usage patterns, and the need to distinguish between viewing of content and viewing of ads.  It's been apparent that DVRs and new distribution channels have made it difficult to sustain the assumption that viewing a program equates with viewing the ad.  That's always been a questionable assumption, but now, viewing on other channels, through VOD, through streaming - all of which don't necessarily carry the same set of embedded advertising - is at the point where advertisers are pushing back at the networks and Nielsen.  This latest move should help solidify the distinction, and push for multiple metrics to met various needs.
  Still, there's a potentially bigger evolutionary force out there - the impact of mobile and the facilitation of place-shifting.  This move doesn't address that issue - the metrics still focus on content consumed on the TV set.  According to Brian Fuhrer, senior vice president-national & cross-platform product leader at Nielsen, wireless broadband is enabling new viewing alternatives - smartphones, tablets, even wireless gadgets connected to TVs.  Nielsen's looking at that, and how that would further redefine "TV."  I'd like to see that come quickly, but dealing with how to best measure and greatly expanded set of viewing options, as well as the continuing explosion in available "TV" content, poses a number of issues that will need to be resolved.  Nielsen indicates it's working towards that, as are a number of Internet-metrics players.  It'll be an interesting race - and one that shouldn't necessarily go to the quickest, the biggest, or the traditional dominant force.  Getting it right is critical to get a true reflection of changing patterns.

Source - Nielsen Redefines 'Television,' Will Include Internet-Only Connected Sets, HouseholdsMediaDail News
America's Living room: More Internet, less wired cable, VatorNews (older story, source of graphics)

Thursday, February 21, 2013

ESPN Rates and Revenues Update

Terms of Time Warner Cable's 2010 deal with ESPN are coming out, and are reaffirming it's dominance among cable network revenue producers.  The information came to light when revealed in court earlier this week as part of the Dish vs. ESPN lawsuit, and reflect the contract terms from September, 2010.  While the terms may have changed or been renegotiated, it's unlikely that the rates have been reduced.
  Under the 2010 agreement, the affiliation fee for ESPN would reach $5.40 per Time Warner subscriber per month by the middle of 2013, reaching $7 per subscriber (per month) in 2017, and $8 around 2020.  Looked at in terms of annual fee inflation, ESPN's price would increase about 6.5% annually.  Dish sought information about Time Warner's deal with ESPN because it's supposedly the lowest rates for ESPN carriage rights.  In other words, that's the minimum and the costs for other multichannel providers may well be higher.
  ESPN currently reaches about 100 million U.S. TV households, almost all through some multichannel service that's paying for the rights to carry ESPN.  Applying those per sub monthly fees over a year for 100 million subs, and you quickly generate some serious cash.  The math suggests that ESPN will earn at least $6.5 billion from subscription fees this year, at least $8.4 billion in 2017, and around $9.6 billion by the end of the decade.  And those numbers don't include earnings from advertising or what's generated by the other ESPN brands.  ESPN clearly generates a lot of revenues and cash flow, even within the huge Disney empire.  In fact, these suggest that the analyst's assumption in the previous post (2011 revenues just under $4 billion) are on the low side.
  ESPN is the golden goose of TV, the gift that keeps on giving, the stock you wish you'd bought 40 years ago.  (Pardon the cliches). 

  At this point, the only thing that seems likely to dramatically change ESPN's revenues track is if the FCC mandated that multichannel video program distributors offer access only through a la carte pricing - that is, consumers would have to order and pay for each network/channel separately.  At $5.40 per month, that would push ESPN's price to $64.80 a year - but if ESPN wanted to keep their revenues level, the subscription price under a la carte would need to be much higher, to compensate for those choosing not to subscribe to ESPN, and to make up for lower advertising revenues resulting from the smaller audience reach.  That's the downside to a la carte pricing - you wouldn't have to "pay" for channels and networks you don't want, but you'd have to pay a lot more for the channels you do want.  Not even ESPN is that valuable - so such a move would almost certainly result in a sizable and significant decline in revenues.

Source -  ESPN Set To Pass $7 Sub Fee In 2017, TVBlog

Facebook in the U.S. - Mixed News from Pew

The Pew Research Center's Internet & American Life Project recently took a look at Facebook usage in the U.S. as a part of their larger omnibus phone surveys of American adults.
  The good news for Facebook is that some two-thirds of online American adults are Facebook users, making Facebook still the dominant social media site in the U.S.  And social media use generally continues to grow: 69% of online adults report using at least one social medium (which translates to half of the entire adult population of the U.S.); 92% of social media users maintain a Facebook profile; and people are using social media more frequently than before - 41% indicate accessing social media sites several times a day.
  One the other hand, 61% of current Facebook users say that they've taken breaks from regular Facebook use of at least a couple of weeks.  And for those who aren't currently using Facebook, 20% used to, but quit, and only 8% said they were interested in joining Facebook.  According to the Pew Report,
Some of the verbatim thoughts from those who took Facebook breaks include the following: “I was tired of stupid comments.” …  “[I had] crazy friends. I did not want to be contacted.” … “I took a break when it got boring.” …  “It was not getting me anywhere.” …  “Too much drama.” ... “You get burned out on it after a while.” … “I gave it up for Lent.” … “I was fasting.” … “People were [posting] what they had for dinner.” …  “I didn’t like being monitored.” … “I got harassed by someone from my past who looked me up.”…  “I don’t like their privacy policy.” … “It caused problems in my [romantic] relationship.”
A lot of the same reasons were cited by those dropping Facebook.
  When asked about the value of Facebook in their lives, more users reported Facebook becoming less valuable and important in the last year (28%) than thought Facebook had become more valuable and important (12%).  In addition, more reported their use decreased over the last year (34%) than indicated that they had increased their Facebook use (13%).  The bad news for Facebook is that the declining use is highest among the key demographics advertisers want to reach.  In the key 18-29 age bracket, 42% of users reported decreasing their time on Facebook in the last year; among those 30-49, 34% reported using Facebook less.

When asked about future Facebook use, most thought it would be about the same.  However, only 3% indicated they would be using Facebook more, while 27% thought they would be using it less.  Here, again, there were also demographic differences, with younger users being the most likely to anticipate reducing their Facebook time (and only 1% thinking of increasing).

It would seem that Facebook has been morphing from the hip, cool, must-have app for the younger generation, to a useful tool for keeping contact with friends and family as people move and disperse.  As for the younger generations, other research results suggest they're not abandoning social media; rather, they're shifting their focus to other social media sites - Twitter in particular.

Source -  Coming and Going on Facebook,  Report from Pew Internet & American Life Project


Wednesday, February 20, 2013

How big a deal is ESPN?

An earlier post on the DISH-ESPN conflict over rights fees got me wondering... Just how big a deal is ESPN?
  Some online checking suggests its quite a big deal for corporate owner Disney.  One financial analyst called ESPN "Disney's Reliable Cash Cow."  His look at Disney's annual reports suggests that the ESPN networks represent about 43% of Disney's operating income.
  According to the annual report, Disney's Media Networks business segment contributes about 46% of total revenues.  The next biggest sector, Parks & Resorts, contributes 29%.  Media Networks also reports the highest operating margin at 38%; in contrast, Parks & Resorts posts a 10% operating margin.  So looking at operating income, 67% comes from Media Networks.
  Looking within the Media Networks segment, Broadcasting networks account for 15% of operating income, and Cable networks 85%. comments from Disney executives and notes in the 2011 annual report suggest that ESPN accounts for roughly three quarters of Cable networks revenues.  If that same proportion holds true for operating income, that means that ESPN accounts for roughly 63% of Media Networks operating income, or about $3.93 billion (43% of total operating income of $9.13 billion).  Since the Cable Networks has an operating margin of 41% (much higher than any other Disney business segment), the estimates above are likely on the low side.
  And the Cable Networks and ESPN numbers are growing, with operating margins improving year-to-year, affiliate fees growing 9%, and advertising revenues up 14% (driven mainly by higher ad rates on ESPN's channels). Not to mention growing audience numbers.
This trend should continue. ESPN has contractual agreements with the world's greatest sports events, including NFL, NBA, and MLB games, Wimbledon, the Indy 500, NASCAR, college sports, and cricket. And to put the icing on the cake, ESPN recently renewed its contract to get the rights to 17 Monday Night Football games every year between 2014 and 2021. ESPN's great live sports and unmatched coverage should continue to reward Disney investors over the next decade.
That suggests ESPN will continue to be a reliable source for revenues, even with rapidly increasing rights fees for major sports that are resulting from the increasing competition from new & emerging sports cable networks.  (Fox, NBC, and CBS are all making major investments in content for their increased number of sports cable networks.)

Source - ESPN: Disney's Reliable, Cash CowThe Motley Fool

Just How Different Are Mobile Tweeters?

A recent study by Twitter looked at the behavior of people who mostly access and use Twitter through mobile devices, and found that they're quite a different bunch.

Mobile and Twitter would seem to go together, and 60% of users log in on a mobile device at least once a month.  But what about users who primarily use Mobile devices to access Twitter and tweet?
  As you might suspect, primary mobile users are 57% less likely to use desktops for Twitter access than the average Tweeter.  On the other hand, they're 86% more likely to report using Twitter via mobile devices several times a day.  While smartphones remain they dominant means of mobile access, 15% of primary mobile users say they mostly use tablets for access.  Demographically, the study suggests that primary mobile users tend to be younger, but there seems to be no gender differential.
  The biggest differentials are in how primary mobile users make use of Twitter. They're more likely (than the average Twitter user) to use Twitter when they wake up (157%), and when they go to bed (129%).  They're more than three times more likely to use Twitter during daily commutes, 160% more likely to Tweet during work or school, 169% more likely to Tweet while shopping, and 301% more likely to Tweet just before or after watching a movie, and 32% more likely to Tweet while watching TV.
  They're also 62% more likely to communicate with people near them (trading locations or sharing a photo).

  Still, one of the most interesting findings is that primary mobile users are not only more active in accessing Twitter, but in actively using Twitter to share thoughts and content.  They're 57% more likely to create Tweets, 78% more likely to Retweet, and 85% more likely to "Favorite" tweets.  And the good news for advertisers is that they're also 63% more likely to click on links.  The folks at Twitter doing the study talked of primary mobile users being "amplifiers" that drive engagement.

I'm not surprised - mobile is opening new opportunities for communication and information access, and we're seeing changes in how people access and use information.  Mobile is also continuing its growth globally.  According to the ITU, more than half of all mobile subscribers use smartphones and/or tablets as their primary device, and more people access the Internet through mobile devices than through land lines.  There's a strong potential for mobile to be a transformational technology, changing the way people access and use media and media content. Media need to track, understand, and take advantage of those changes to remain successful over the long term.

Source -  New Compete study: Primary mobile users on Twitter, Twitter's Advertising Blog
Edit - Cleaned things up a bit. (2/20/2013)

Tuesday, February 19, 2013

Traffic updates from Cisco

Cisco's Global mobile and visual data traffic reports and forecasts are out for 2012 and beyond, and the key finding is that they've significantly lowered their forecast data traffic growth rates in some key areas from their 2011 forecasts.  They attribute the revision to several fundamental shifts in usage patterns in 2012.
  Now data traffic is still growing rapidly across the globe, and mobile data traffic grew 70% in 2012.  In fact, Cisco notes, last year's mobile data traffic (885 petabytes per month) was twelve times the entire global data traffic in 2000 (75 petabytes per month).  Last year was also the first that saw mobile video traffic account for half of all mobile data traffic.  Last year also saw mobile data connection speeds doubled - avg. download speeds for smartphones were just above 2 Mbps, for tablets, average connection speeds were near 3.7 Mbps.  And data traffic is still projected to grow exponentially, just at a slightly lower rate.
  2012 also saw the number of mobile-connected tablets increase 250%, reaching 36 million, and the number of 4G mobile subscribers approached one percent of all mobile connections.  Still, even with that low early penetration, 4G mobile subscribers generated 14% of all mobile data traffic.  These high-end mobile devices all push mobile data traffic higher, so that continued diffusion will continue to drive continued rapid growth in mobile data traffic.
  As for the changes, they're attributable to shifts in usage patterns driven by pricing strategies interacting with improved mobile devices.  The report notes that the growth rate for mobile-connected laptops has slowed, as users move to smartphones and tablets as their primary mobile devices.  The report also notes that the rise of mobile devices has shifted some use from wired connections to mobile, and particularly WiFi wireless connections.  In particular, Cisco indicated that 2012 saw "higher than expected tablet usage on WiFi."  Finally, 2012 saw the widespread implementation of tiered and capped mobile data plans from mobile operators.  The new plans and caps also pushed a lot of mobile traffic to WiFi home nets connected to fixed network providers.  The report suggested that about a third of all data traffic generated by mobile devices was offloaded to the fixed network, rather than remaining on the user's mobile service.  To the extent that shifting data usage was a strategic goal (to prevent overloading of older, low bandwidth mobile services, this can be interpreted as attempts to make more efficient use of the current mix of data services and access technologies.
  Another way of looking at this is that consumers are becoming smarter - shifting some uses to mobile devices for convenience and 24/7 accessibility, shifting high-data-traffic usage to cheaper and free access points, and shifting emerging usage patterns as mobile service plans evolve to usage-based pricing.

  Lost in all this is the transformation of mobile service business model.  The foundational services of voice and SMS are experiencing declining revenues as users shift to free IP Voice and conferencing services, and the fact of declining costs continues to drive price competition among competitors. 
Swisscom’s CEO believes that the company’s voice and SMS revenue will be gone within three years. If we strip away these declining revenue streams, we’re left with the future of an operator’s business, namely internet/data connectivity.
  Thus, finding the best options for monetizing data carriage is becoming critical for mobile and wireless operators.  The growing number of Internet users and rapidly rising demand for a wide range of Internet services and content suggests that there's a growing market for online content and services that can be tapped.  The still rapid growth in mobile and mobile video data traffic, as seen in the latest Cisco report amply reflects continuing demand.  The report also suggests that usage patterns are still evolving, and can be influenced by pricing strategy.  Understanding the motives and behaviors of users, particularly in response to pricing changes and strategies, will be vital for long-term business success, either as a access provider or content and service provider.

Sources -  Improved traffic distribution indicates that operators are managing assets more effectivelytelecoms.com
Cisco Visual Networking Index: Global Mobile Data Traffic Forecast Update, 2012-1027, Cisco press release.
Cisco Visual Networking Indes: Global Mobile Data Traffic Forecast Update, 2012-2017.  Full report from Cisco.

Internet speeds up in U.S.

  The FCC report indicated that the average subscriber speed in their sample was 15.6 Mbps in September, 2012 - an increase of 20% over the previous six months.  In addition, the FCC's volunteer (i.e. nonrandom) sample reported access speeds up to 75 Mbps, well into the range considered fast broadband.  While the nonrandom nature of the sample means that we shouldn't extrapolate reported results onto the general U.S. population, there's still strong indication that speeds are increasing, and broadband access is expanding.
   The focus of the FCC study is to examine whether internet access providers consistently reach the data speeds they advertise.  Cable companies did well, with average speeds reaching 99% of advertised speeds - but fiber optic providers actually exceeded advertised rates by 15% (average speeds were 115% of advertised speeds).  In contrast, more than half of older DSL providers had average speeds less than 90% of those advertised.  I should note that DSL is well on its way to becoming a legacy technology, largely unable to match the bandwidth and data speeds of fiber optic based wireless access providers (be they cable or telco fiber networks).  As such, I would not be surprised that DSL would occasionally deliver subpar performance.
  While the focus of the report was on wireline Internet access, the FCC did consider one wireless technology - satellites.  The report noted that a new generation of satellites offer significantly higher access speeds and improved performance.  They note that the new ViaSat-1 Ka-band satellite hosts more bandwidth than all other Ka-, Ku-, and C-band satellite data services in North America, combined.  As a result, satellite data services can provide 12 Mbps service to all areas of the U.S.  In fact, the FCC report shows that satellite data subscribers regularly achieve higher download speeds than advertised.  That satellite data services are offering broadband speeds is critical to goals of achieving universal broadband access, as it provides an option for rural areas unlikely to see wireline network expansion for years to come.

  The big news of the report, though, is that speeds are ramping up, and consumers are following,  At least 10% of subscribers in each of the April 2012 service tiers reported moving to a higher-speed service.  The movement is highest at the low end, with almost half (46%) of the sample with 1 Mbps or slower service in April 2012 moving to a higher-speed service.  A subset of the FCC sample also tracked data traffic, and found a correlation between service plan speeds and data traffic generated.  It's unclear whether that pattern is driven by greater speeds encouraging more data use, high data users migrating to faster service plans as they come available, or some combination of those and other factors.
  The graph of cumulative distribution of data traffic suggests some other interesting results.  First, that 10% of cable and fiber subscribers in that subsample generated at least 160 Gb of data traffic a month, as do 5% of DSL subscribers.  And that was after the researchers excluded users in the sample with very high consumption profiles, and subscribers of some very fast services with low subscription rates.  That is, you had those levels even after excluding the really high data traffic cases.  The other interesting result is the Satellite cumulative distribution curve.  The shift from a general curve to the two plateaus illustrates one of the current limitations of satellite data services - that their service plans tend to have fairly low monthly caps on traffic (beyond which costs go up substantially, or service is restricted).
  The FCC concluded that bandwidth speeds are continuing to advance, while actual performance showed some improvement, in terms of Internet access providers generally meeting their advertised standards.  Findings that were consistent with previous reports. Still, speeds are expected to continue to increase; In their conclusions, they note that a number of cable and fiber access providers are offering 100 Mbps or higher data plans in selected areas, and Google's 1 Gbps service in Kansas City.  The report also indicated that they plan on addressing one significant gap in their current approach, by taking a look at mobile broadband services.  With 4G offering the potential for high speed mobile broadband, and the FCC's recently announced goal of developing a new national mobile broadband service. the mobile segment will likely be an increasingly important segment of the broadband access market.

  As always, the report has a lot more detail, and if you want to check how your technology/provider grades out, go there.

Sources -  Web Users Pick Up Speed, ISP's DSL Service SketchyOnline Media Daily
2013 Measuring Broadband America: February Report,  FCC report