Showing posts with label news use. Show all posts

Wednesday, April 29, 2015

Pew - State of Local TV News

Pew has just released its State of the News Media 2015 report, and I'll be sharing some results and comments.

2014 saw local TV station revenues increase (mostly from huge rise in political advertising), and some increased viewing for most local news programs.  Overall revenues increased 7% from the previous year, but still remained below 2012 numbers (when even more political advertising and the Presidential race helped spike local TV revenues).
The year also saw a continuation of the rise in the share of revenues coming from news programs, accounting for 84% of over-the-air revenues.  While good news for potential growth of local news programs and coverage, I'm not convinced that such a level of reliance on one programming source for station revenues is good for the long-term financial health of local broadcast TV.

The study also predicted a substantial growth in retransmission consent fees (from SNL Kagan numbers) over the next few years.  This comes with three big caveats, however;

  • Broadcast networks are demanding an increasing share of retransmission consent fees from local broadcasters, so it is unlikely that local stations will benefit that much from projected increases
  • It's starting to look like multichannel rights fees are starting to plateau.  Larger MSOs are starting to resist network demands for licensing fees, as the amounts are approaching audience perceptions of value.  This is contributing to cord-cutting and the push for a shift to "a la carte" pricing.
  • The economics of "a la carte" are likely to be substantially different than the existing business model, and are unlikely to sustain current revenue levels.  Particularly for local TV broadcasters, which must provide their primary service broadcasts free to the public (by FCC regulations)

As for local TV news, Pew notes that the number of hours of local TV news seems to have reached a plateau.  That's one factor contributing to limited growth in news staff salaries.

(I'm trying Pew's embed function for the graphics - my apologies if it's not working right)

Source - The State of the News Media 2015, Pew Research Center report

Monday, March 31, 2014

Pew: Social News

Pew's State of News Media 2014 report includes a look at the growing role of social media in news consumption.  Here's some highlights:
  • News has a place in social media, but usage varies by site.  Half of Facebook and Twitter users get news through their sites, as do 62% of Reddit users.  With Facebook's high penetration, that means about 3 in 10 Americans get some news from Facebook.  There's also some variation in use by site: Twitter is used to get breaking news, while Facebook is used more to share news with friends and followers.  78% of those getting news via Facebook see news items while using Facebook for other purposes.
  •  Audiences for news on social media differ by platform
  • Social media carries, and is used by news consumers, for a wide range of topics.  Almost half of Facebook news users report that they get news on 6 or more topics.  Top news categories on Facebook include Entertainment News, Local community news, and sports. Local news topics account for at least 3 of the top 10 topics (I suspect a lot of the interest in, and use of, sports news is about local teams and events).
  • Social news users not only get news via their social media, they're increasingly engaged with it: sharing or reposting news, discussing news, and posting their own photos, videos, and information about news events.  
  •  News consumers who go directly to news sites for their news tend to be much heavier news users than those who get to news sites through Facebook or search engines.  Those going directly to news sites go more often, consume more content, and spend more time than those arriving at news sites via referrals from social media and search engines.
  • On Twitter, groups of people often come together in response to news events they care about.  These groups tend to be those with strong opinions, which aren't likely to reflect broad public opinion.  In addition, the rapid pace, short content limits, and lack of gatekeeping on Twitter means that initial opinions may be moderated as news consumers get more information

 Sources -  8 Key Takeaways about Social Media and News,  PewResearch Journalism Project report
State of the News Media 2014, full PewResearch Journalism Project study

Monday, December 2, 2013

Cable News News: Big drops

Considering that last November was a Presidential election year, its hardly surprising that this years cable news network ratings are down.  The actual numbers though, are somewhat shocking - both in isolation and as trends.  They can even serve as a guide to reporting bias.
  • Left-leaning coverage will gloat over Fox News Channel's drop of 21% in total viewing.
  • Right-leaning coverage will trumpet CNN and MSNBC losing half their primetime audience.
  • Interesting, in looking over news reports, there's a lot of a third tack - discussing the CNN - MSNBC battle (for a very distant second) and ignoring or burying the Fox News numbers.
This year's numbers for November had FNC (Fox News) attracting more than 2 million viewers in primetime over the November ratings period (down 18%), with MSNBC pulling in 752,000 (down 50%) and CNN with 488,000 (down 54%).  In terms of total viewing, Fox was down 21% from last year's numbers, MSNBC fell by 45%, and CNN by 48%.

For CNN, that's 15 straight months of declining audience numbers.  And while Fox was also down, it ended the month coming in second (to ESPN) in primetime viewing, and still pulled in more viewers than all the other cable news networks combined.  November 2013 marked the 143rd straight month with Fox News as the top cable news network.


Sources: Nov. 2013 Ratings: CNN Hits Year Low,  TVNewser
November 2013 Cable News Ratings: MSNBC Tops CNN; Numbers Down From Last Year,  Huffington Post
Cable News Ratings: Fox News Channel Leads November As Nets Drop Sans Election Coverage, Multichannel News

(edited 10/2/2013 to add keywords)

Friday, November 15, 2013

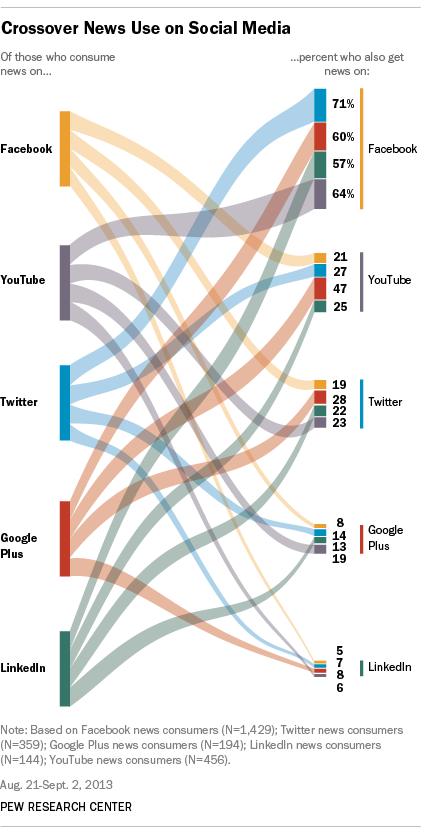
Pew Research Graphic- Crossover among social media sources for news.

Part of a larger general report on how US Internet users use social media sites for news, this is a visually interesting illustration of how people use multiple sites.

Source -  News Use Across Social Media,  PewResearch Journalism Project research report.

Tuesday, April 9, 2013

The State of US Newspapers, Part 2

The Newspaper Association of America (NAA) has released its annual report, which provides some details on the state of the US newspaper industry beyond what appeared in the Pew overview report on news media that served as the basis for the previous post.

  The NAA report is a bit more dismal - once correcting for inflation, it notes that newspaper print advertising revenues were lower than any point since the NAA started collecting data in 1950.  As for the more recent trend, print ad revenues in constant dollars fell by nearly 50% in the last four years, and 66% in the last decade.  Even when adding in online ad revenues, earnings from advertising were at the lowest level since 1953.  In terms of total newspaper revenues, digital advertising's share went from 10% in 2011 to 11% in 2012, and circulation revenues' share increased from 26% in 2011 to 27% in 2012.


The NAA report noted that newspapers are starting to exploit a number of supplemental revenue streams:
  • Digital agency and marketing - helping local businesses with digital (including social and mobile) marketing efforts
  • E-commerce and transactions (for themselves, and/or through using their platforms to let local advertisers connect directly with customers)
  • Event marketing - producing events tied to coverage areas as another way of getting information to audiences
  • Commercial delivery of non-newspaper products (fliers, phone books, etc.)
  • Commercial printing revenue - using presses when idle for other print jobs.
 The list is by no means comprehensive - newspapers are continuing to experiment with a number of other potential business activities.  In particular, the current efforts at establishing copyright protections, and copyright enforcement, may signal efforts to increase licensing and royalty revenues.

  NAA data on readership notes that total weekly audience (read a paper or accessed online news at least once a week) fell 2% in 2012.  The NAA has also released a more comprehensive readership study using a non-random sample (which limits generalizability).  Their study confirmed that older, more educated, and wealthier individuals are more likely to be newspaper readers.  It also found that the only areas where readership experienced gains in recent years was among social media and mobile users.  Mobile users in particular might help readership numbers - the study found that 17% of mobile users reported that they only accessed newspaper content through mobile devices - accounting for 4% of "weekly readers."

  The report notes, though, that social media and mobile are delivery mechanisms, and for the most part are not direct news content creators - and as such, the continued diffusion of social and mobile media, and growth in usage, is likely to expand newspaper content readership over time (particularly among younger audiences).
54% of adults 18-24 consume newspaper content in print or on conventional computers, according to the Scarborough data. When combined with the audience for that same group who uses smartphones or tablets exclusively to connect with newspaper content in an average month, the 18-to-24 audience rises to almost 6 in 10 (59%).
In essence, the report notes that while print is in decline, digital media of all sorts is extending the reach of newspapers and other legacy media, particularly among younger audiences - the demographic that has bottomed out at around 20% regular readership of printed newspapers.

Sources -  Free-fall: Adjusted for inflation, print newspaper advertising revenue in 2012 was lower than in 1950,  AEI-Ideas.org
The American Newspaper Media Industry Revenue Profile 2012, NAA report
Accros Platforms, 7 in 10 Adults Access Content from Newspaper Media Each Week, NAA report.

Thursday, February 7, 2013

Slow start for Millennials

A major new study of Millennials (18-29 age group) in the U.S. and civic participation has some good news and some very bad news.

  • Roughly half voted in the 2012 U.S. Presidential race, significantly less than the previous two Presidential elections (the report indicates that level is consistent with voting levels in the 1970s and 1980s
  • Millennials lead the nation in terms of civic use of social media, but continues to decline for almost all other (traditional) indicators of civic engagement and civic participation.  The study's report asserts that media often portrays Millennials as apathetic, lazy, and disengaged from their local communities, labeling these as misconceptions. 
      Immediately afterwards, though, the study concludes that - "many Millennials remain alienated and disempowered"; use news media less; are less likely to volunteer to help local community groups;  has voting turnout that's "one of the lowest youth turnout rates in the world"; that the most cited reason for not voting was "Washington being broken" (43%); Millennials were almost twice as likely to not trust their neighbors, and significantly less likely to exchange favors with neighbors than older populations; less likely to discuss current events with others (either online or in person); less likely to volunteer in their community; that those aged 22-25 are particularly "disengaged"; are 40-60% less likely to become a civic leader or voice (depending on marital status and having kids) than older people; and much less likely to participate in civic service activities.
      It raises the question of whether the so-called media stereotypes really are that wrong.
  • Interestingly, it's Millennials in the urban Northeast that are the least likely to engage in civic service activities
  • For Millennials, having a college education (or better) is a better predictor of socio-economic status than income.
  • While the official unemployment rate for Millennials is 9.7% (about 20% higher than the national average), the report indicates that only 63% of all those under 30 are employed. The remaining 27% are "out of the labor force" (students, stay-at-home parents or caregivers, those who have given up looking for work, etc). 
      However, the study also reports that almost a third of the "employed" are only working part-time. That means the aggregate employment numbers are: 43.5% employed full-time, 19% employed part-time, 9.7% unemployed and looking for jobs, and 27% unemployed but not looking for work.  The study notes that unemployment for younger Millennials (under 25) runs twice the national average (around 16%), and up to 4 times national average for Hispanic and Black youth.
Reading the language of the report, you can see the spin that the sponsors (civic groups trying to promote civic engagement) are trying to put on the numbers, which really aren't very supportive.  That is, unless you're an organization seeking funding to promote greater civic engagement.

Sources -  "Millennials" Play a Central Role in our Nation's Civic Health, but Who are They?, press release, National Conference on Citizenship
Millennials Civic Health Index, for downloadable study report.

Note; Infographic comes from a different study, and was added to provide additional background.